
Sterling currently trades at $224.02 and has been a dream stock for shareholders. It’s returned 2,079% since June 2020, blowing past the S&P 500’s 92.3% gain. The company has also beaten the index over the past six months as its stock price is up 27.9% thanks to its solid quarterly results.
Is it too late to buy STRL? Find out in our full research report, it’s free.
Why Are We Positive On STRL?
Involved in the construction of a major highway, the Grand Parkway in Houston, TX, Sterling Infrastructure (NASDAQ: STRL) provides civil infrastructure construction.
1. Skyrocketing Revenue Shows Strong Momentum
A company’s long-term performance is an indicator of its overall quality. Any business can experience short-term success, but top-performing ones enjoy sustained growth for years. Luckily, Sterling’s sales grew at an impressive 11.9% compounded annual growth rate over the last five years. Its growth surpassed the average industrials company and shows its offerings resonate with customers. 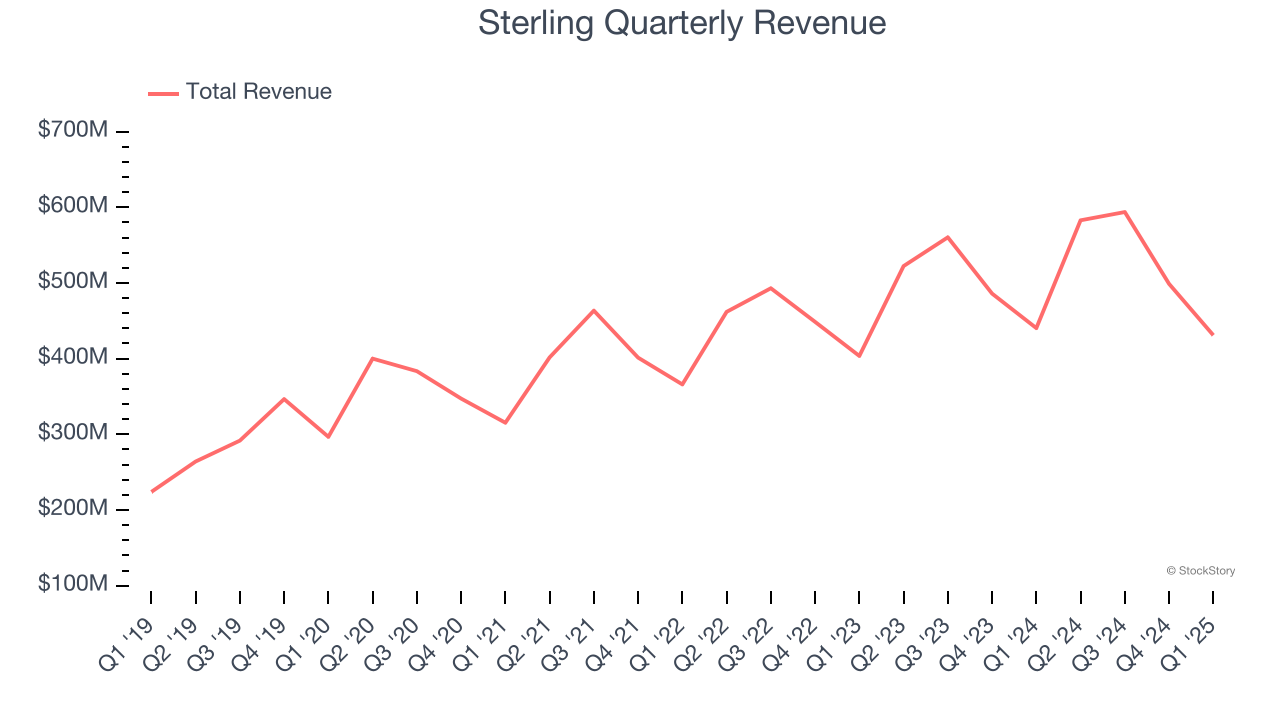
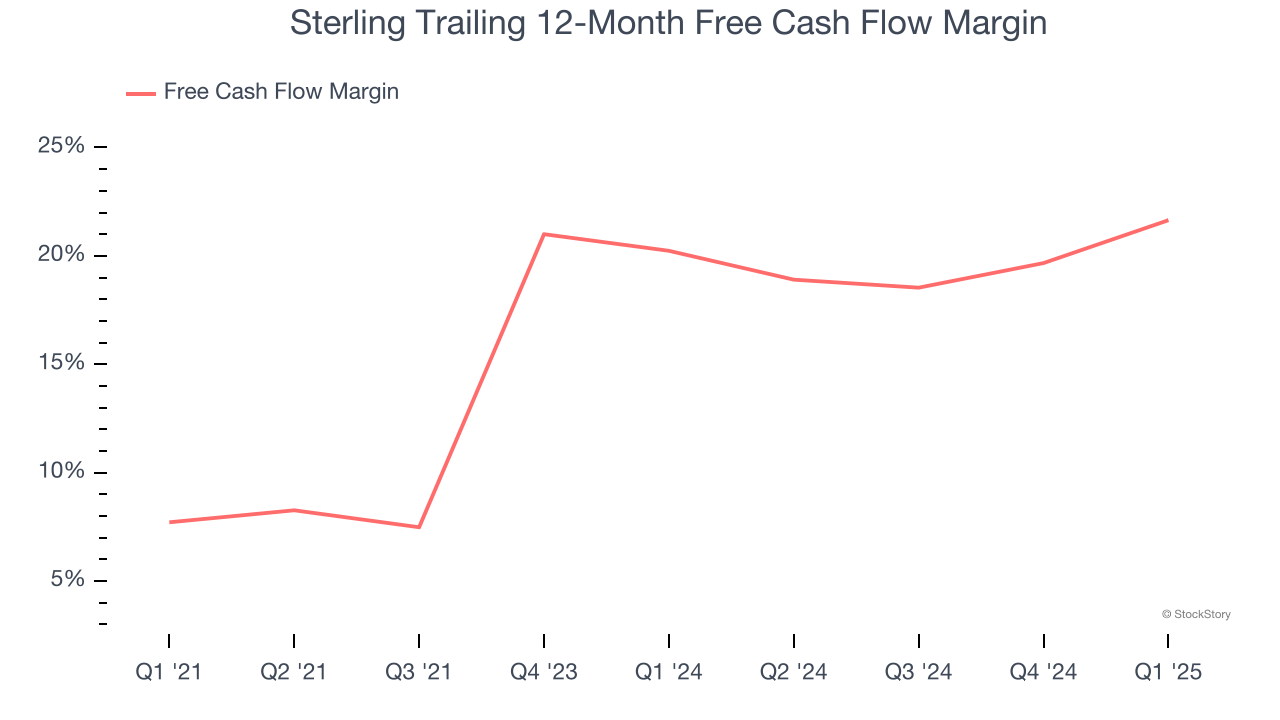
2. Increasing Free Cash Flow Margin Juices Financials
If you’ve followed StockStory for a while, you know we emphasize free cash flow. Why, you ask? We believe that in the end, cash is king, and you can’t use accounting profits to pay the bills.
As you can see below, Sterling’s margin expanded by 13.9 percentage points over the last five years. This is encouraging, and we can see it became a less capital-intensive business because its free cash flow profitability rose more than its operating profitability. Sterling’s free cash flow margin for the trailing 12 months was 21.6%.
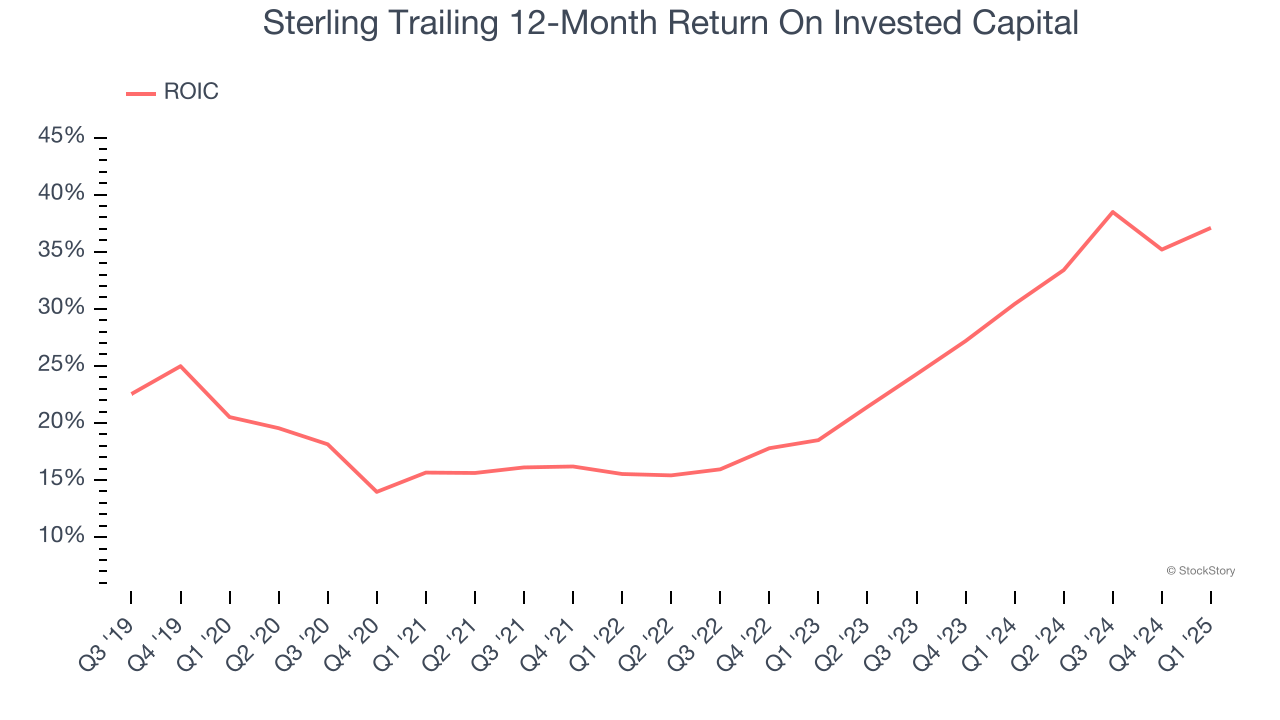
3. New Investments Bear Fruit as ROIC Jumps
A company’s ROIC, or return on invested capital, shows how much operating profit it makes compared to the money it has raised (debt and equity).
We like to invest in businesses with high returns, but the trend in a company’s ROIC is what often surprises the market and moves the stock price. Fortunately, Sterling’s ROIC has increased significantly over the last few years. This is a great sign when paired with its already strong returns. It could suggest its competitive advantage or profitable growth opportunities are expanding.
Final Judgment
These are just a few reasons why we're bullish on Sterling, and with its shares outperforming the market lately, the stock trades at 28.1× forward P/E (or $224.02 per share). Is now the time to initiate a position? See for yourself in our in-depth research report, it’s free.
Stocks We Like Even More Than Sterling
Donald Trump’s victory in the 2024 U.S. Presidential Election sent major indices to all-time highs, but stocks have retraced as investors debate the health of the economy and the potential impact of tariffs.
While this leaves much uncertainty around 2025, a few companies are poised for long-term gains regardless of the political or macroeconomic climate, like our Top 5 Growth Stocks for this month. This is a curated list of our High Quality stocks that have generated a market-beating return of 183% over the last five years (as of March 31st 2025).
Stocks that made our list in 2020 include now familiar names such as Nvidia (+1,545% between March 2020 and March 2025) as well as under-the-radar businesses like the once-small-cap company Exlservice (+354% five-year return). Find your next big winner with StockStory today.