Over the past six months, JLL’s shares (currently trading at $237.44) have posted a disappointing 6.1% loss, well below the S&P 500’s 1.1% gain. This might have investors contemplating their next move.
Is now the time to buy JLL, or should you be careful about including it in your portfolio? Dive into our full research report to see our analyst team’s opinion, it’s free.
Why Do We Think JLL Will Underperform?
Even though the stock has become cheaper, we don't have much confidence in JLL. Here are three reasons why there are better opportunities than JLL and a stock we'd rather own.
1. Long-Term Revenue Growth Disappoints
A company’s long-term sales performance can indicate its overall quality. Any business can have short-term success, but a top-tier one grows for years. Over the last five years, JLL grew its sales at a sluggish 5.7% compounded annual growth rate. This fell short of our benchmark for the consumer discretionary sector. 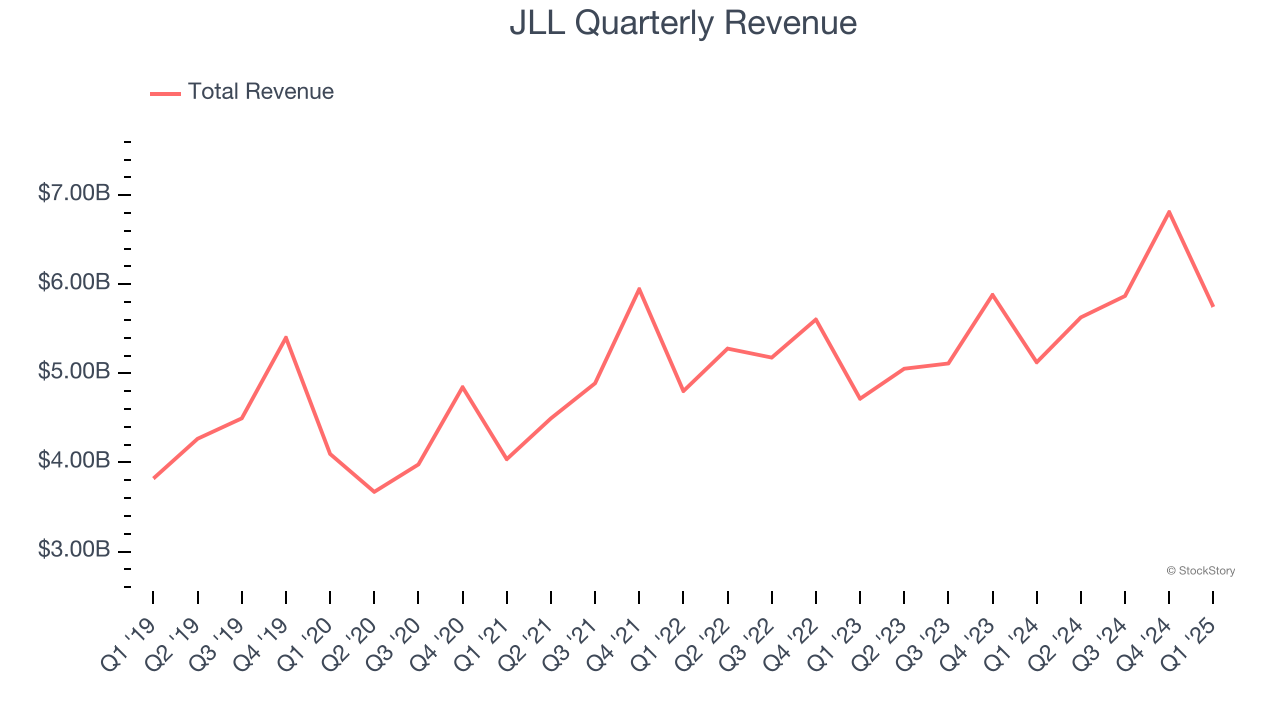
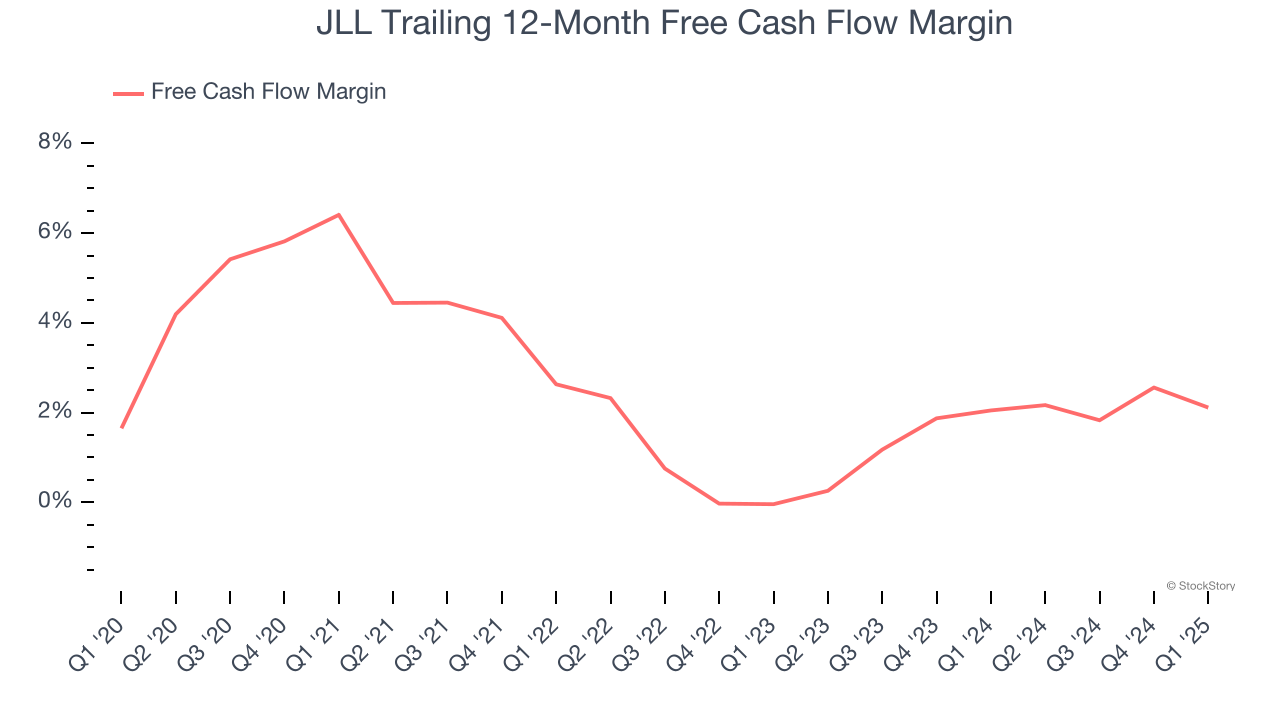
2. Mediocre Free Cash Flow Margin Limits Reinvestment Potential
Free cash flow isn't a prominently featured metric in company financials and earnings releases, but we think it's telling because it accounts for all operating and capital expenses, making it tough to manipulate. Cash is king.
JLL has shown poor cash profitability over the last two years, giving the company limited opportunities to return capital to shareholders. Its free cash flow margin averaged 2.1%, lousy for a consumer discretionary business.
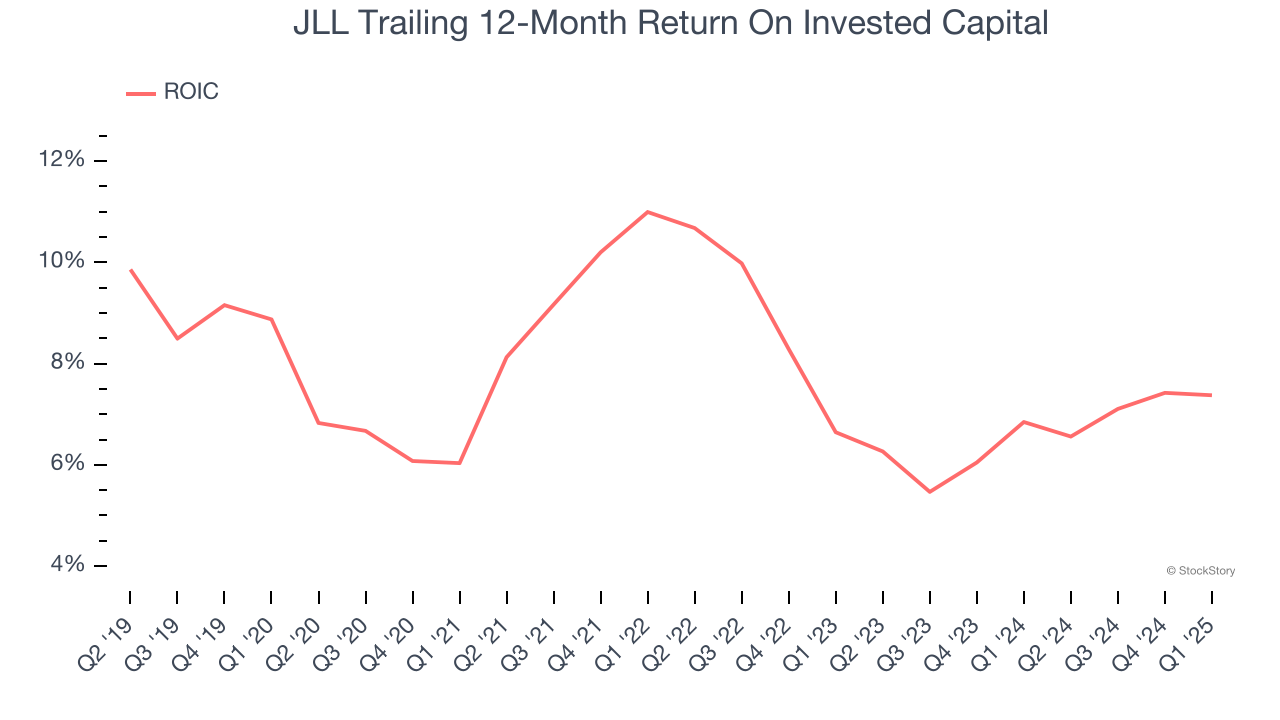
3. Previous Growth Initiatives Haven’t Impressed
Growth gives us insight into a company’s long-term potential, but how capital-efficient was that growth? A company’s ROIC explains this by showing how much operating profit it makes compared to the money it has raised (debt and equity).
JLL historically did a mediocre job investing in profitable growth initiatives. Its five-year average ROIC was 7.6%, somewhat low compared to the best consumer discretionary companies that consistently pump out 25%+.
Final Judgment
JLL falls short of our quality standards. After the recent drawdown, the stock trades at 14.3× forward P/E (or $237.44 per share). At this valuation, there’s a lot of good news priced in - we think there are better opportunities elsewhere. We’d recommend looking at one of our top software and edge computing picks.
Stocks We Would Buy Instead of JLL
Donald Trump’s victory in the 2024 U.S. Presidential Election sent major indices to all-time highs, but stocks have retraced as investors debate the health of the economy and the potential impact of tariffs.
While this leaves much uncertainty around 2025, a few companies are poised for long-term gains regardless of the political or macroeconomic climate, like our Top 9 Market-Beating Stocks. This is a curated list of our High Quality stocks that have generated a market-beating return of 183% over the last five years (as of March 31st 2025).
Stocks that made our list in 2020 include now familiar names such as Nvidia (+1,545% between March 2020 and March 2025) as well as under-the-radar businesses like the once-micro-cap company Tecnoglass (+1,754% five-year return). Find your next big winner with StockStory today.