Diebold Nixdorf has had an impressive run over the past six months as its shares have beaten the S&P 500 by 17.1%. The stock now trades at $51.81, marking a 18.1% gain. This performance may have investors wondering how to approach the situation.
Is now the time to buy Diebold Nixdorf, or should you be careful about including it in your portfolio? Check out our in-depth research report to see what our analysts have to say, it’s free.
Why Is Diebold Nixdorf Not Exciting?
We’re glad investors have benefited from the price increase, but we're swiping left on Diebold Nixdorf for now. Here are three reasons why we avoid DBD and a stock we'd rather own.
1. Revenue Spiraling Downwards
A company’s long-term sales performance can indicate its overall quality. Any business can have short-term success, but a top-tier one grows for years. Over the last five years, Diebold Nixdorf’s demand was weak and its revenue declined by 2.9% per year. This wasn’t a great result and signals it’s a lower quality business. 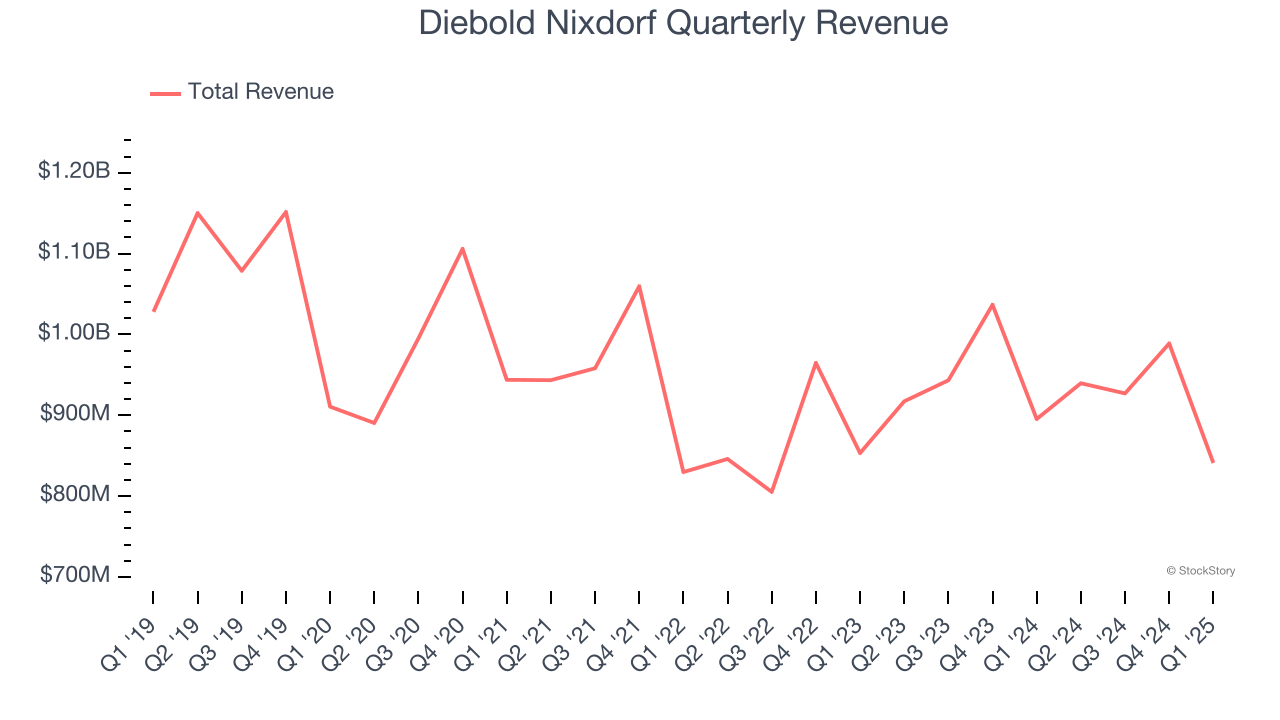
2. Cash Burn Ignites Concerns
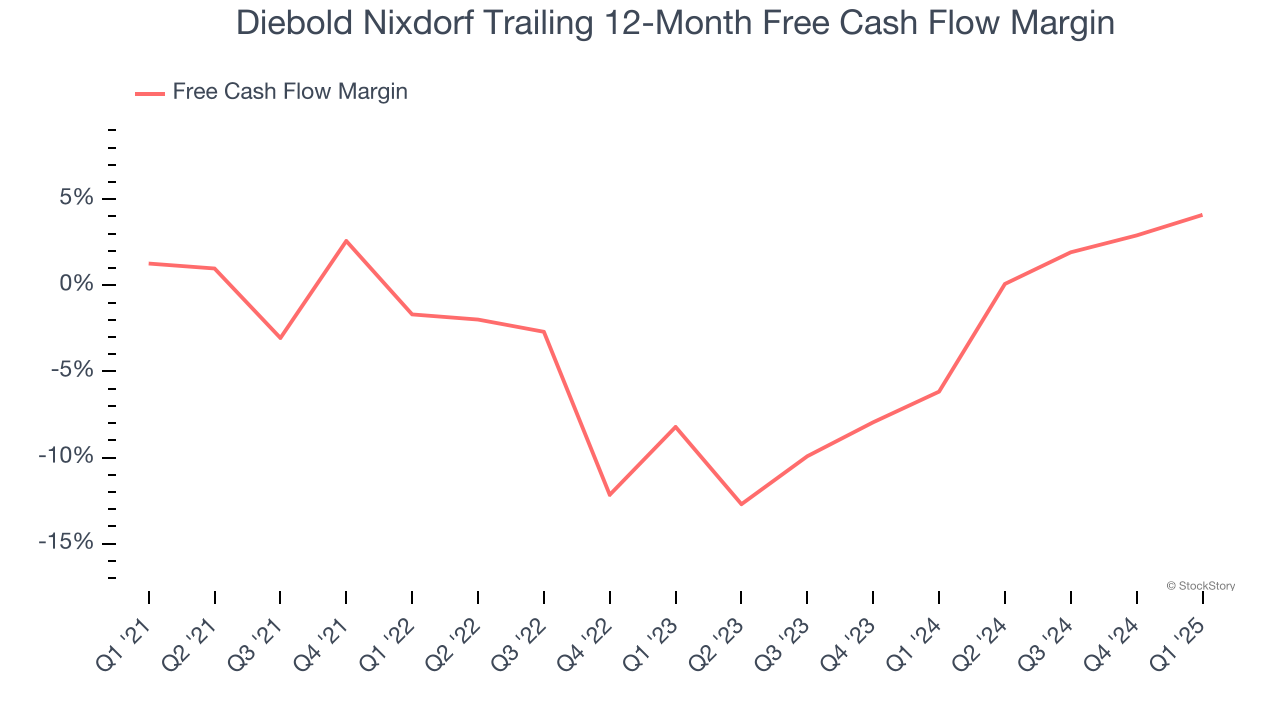
Free cash flow isn't a prominently featured metric in company financials and earnings releases, but we think it's telling because it accounts for all operating and capital expenses, making it tough to manipulate. Cash is king.
While Diebold Nixdorf’s free cash flow broke even this quarter, the broader story hasn’t been so clean. Diebold Nixdorf’s demanding reinvestments have drained its resources over the last five years, putting it in a pinch and limiting its ability to return capital to investors. Its free cash flow margin averaged negative 2%, meaning it lit $2.04 of cash on fire for every $100 in revenue.
3. Previous Growth Initiatives Have Lost Money
Growth gives us insight into a company’s long-term potential, but how capital-efficient was that growth? A company’s ROIC explains this by showing how much operating profit it makes compared to the money it has raised (debt and equity).
Diebold Nixdorf’s five-year average ROIC was negative 6.4%, meaning management lost money while trying to expand the business. Its returns were among the worst in the business services sector.

Final Judgment
Diebold Nixdorf isn’t a terrible business, but it doesn’t pass our bar. With its shares beating the market recently, the stock trades at 13.2× forward P/E (or $51.81 per share). Beauty is in the eye of the beholder, but our analysis shows the upside isn’t great compared to the potential downside. We're pretty confident there are more exciting stocks to buy at the moment. We’d suggest looking at the Amazon and PayPal of Latin America.
Stocks We Would Buy Instead of Diebold Nixdorf
Market indices reached historic highs following Donald Trump’s presidential victory in November 2024, but the outlook for 2025 is clouded by new trade policies that could impact business confidence and growth.
While this has caused many investors to adopt a "fearful" wait-and-see approach, we’re leaning into our best ideas that can grow regardless of the political or macroeconomic climate. Take advantage of Mr. Market by checking out our Top 9 Market-Beating Stocks. This is a curated list of our High Quality stocks that have generated a market-beating return of 183% over the last five years (as of March 31st 2025).
Stocks that made our list in 2020 include now familiar names such as Nvidia (+1,545% between March 2020 and March 2025) as well as under-the-radar businesses like the once-micro-cap company Tecnoglass (+1,754% five-year return). Find your next big winner with StockStory today.