
Since December 2024, Pilgrim's Pride has been in a holding pattern, posting a small loss of 0.6% while floating around $45.90.
Is now the time to buy Pilgrim's Pride, or should you be careful about including it in your portfolio? Get the full stock story straight from our expert analysts, it’s free.
Why Is Pilgrim's Pride Not Exciting?
We're swiping left on Pilgrim's Pride for now. Here are three reasons why there are better opportunities than PPC and a stock we'd rather own.
1. Long-Term Revenue Growth Disappoints
Examining a company’s long-term performance can provide clues about its quality. Any business can experience short-term success, but top-performing ones enjoy sustained growth for years. Regrettably, Pilgrim's Pride’s sales grew at a tepid 4.5% compounded annual growth rate over the last three years. This fell short of our benchmark for the consumer staples sector. 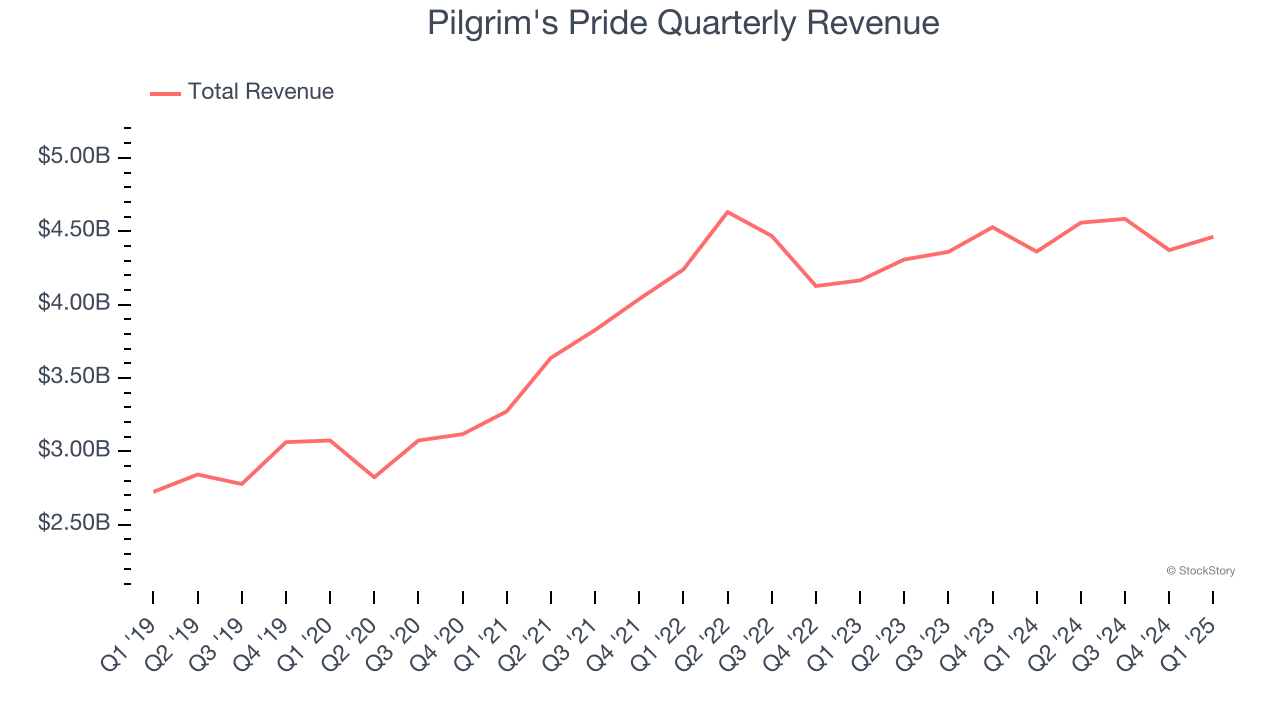
2. Projected Revenue Growth Shows Limited Upside
Forecasted revenues by Wall Street analysts signal a company’s potential. Predictions may not always be accurate, but accelerating growth typically boosts valuation multiples and stock prices while slowing growth does the opposite.
Over the next 12 months, sell-side analysts expect Pilgrim's Pride’s revenue to stall, a deceleration versus This projection doesn't excite us and suggests its products will face some demand challenges.
3. Low Gross Margin Reveals Weak Structural Profitability
All else equal, we prefer higher gross margins because they make it easier to generate more operating profits and indicate that a company commands pricing power by offering more differentiated products.
Pilgrim's Pride has bad unit economics for a consumer staples company, signaling it operates in a competitive market and lacks pricing power because its products can be substituted. As you can see below, it averaged a 10.7% gross margin over the last two years. That means Pilgrim's Pride paid its suppliers a lot of money ($89.27 for every $100 in revenue) to run its business. 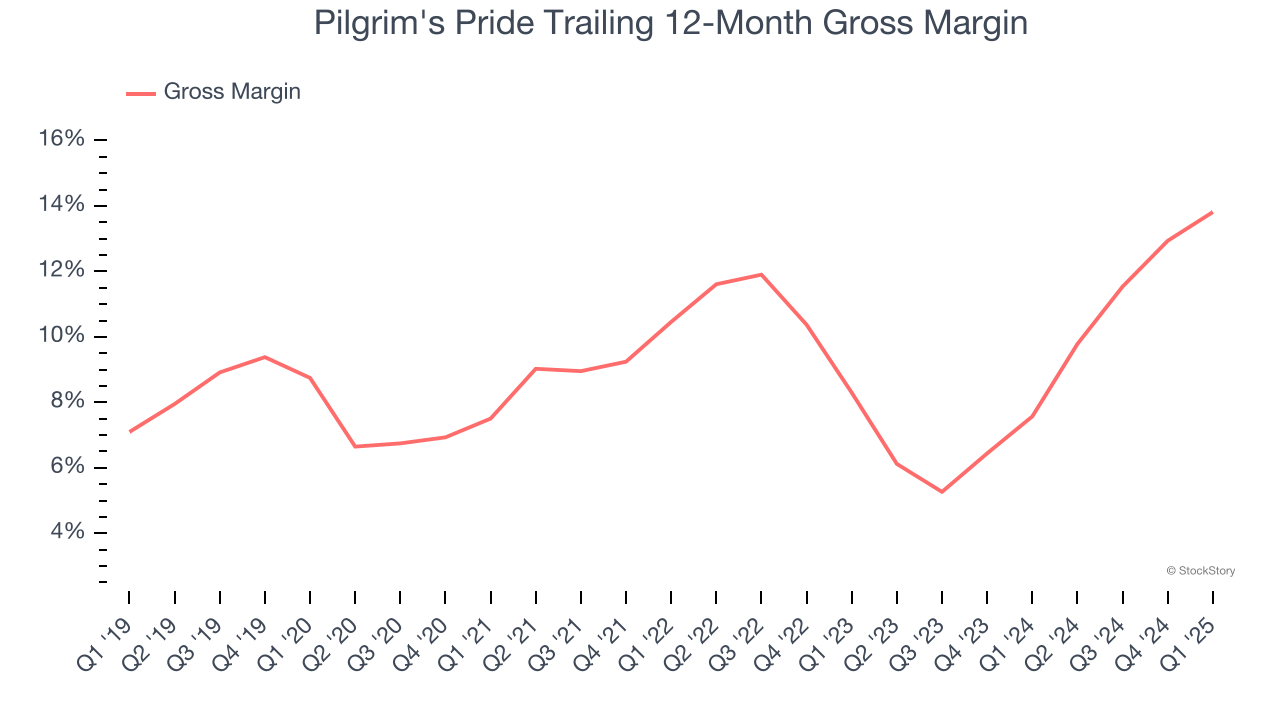
Final Judgment
Pilgrim's Pride isn’t a terrible business, but it doesn’t pass our quality test. That said, the stock currently trades at 9.2× forward P/E (or $45.90 per share). While this valuation is optically cheap, the potential downside is big given its shaky fundamentals. We're fairly confident there are better stocks to buy right now. We’d suggest looking at a dominant Aerospace business that has perfected its M&A strategy.
Stocks We Like More Than Pilgrim's Pride
The market surged in 2024 and reached record highs after Donald Trump’s presidential victory in November, but questions about new economic policies are adding much uncertainty for 2025.
While the crowd speculates what might happen next, we’re homing in on the companies that can succeed regardless of the political or macroeconomic environment. Put yourself in the driver’s seat and build a durable portfolio by checking out our Top 6 Stocks for this week. This is a curated list of our High Quality stocks that have generated a market-beating return of 183% over the last five years (as of March 31st 2025).
Stocks that made our list in 2020 include now familiar names such as Nvidia (+1,545% between March 2020 and March 2025) as well as under-the-radar businesses like the once-small-cap company Comfort Systems (+782% five-year return). Find your next big winner with StockStory today.
