Restaurant company Darden (NYSE: DRI) met Wall Street’s revenue expectations in Q2 CY2025, with sales up 10.6% year on year to $3.27 billion. Its GAAP profit of $2.58 per share was 12.1% below analysts’ consensus estimates.
Is now the time to buy Darden? Find out by accessing our full research report, it’s free.
Darden (DRI) Q2 CY2025 Highlights:
- Revenue: $3.27 billion vs analyst estimates of $3.26 billion (10.6% year-on-year growth, in line)
- EPS (GAAP): $2.58 vs analyst expectations of $2.94 (12.1% miss)
- EPS (GAAP) guidance for the upcoming financial year 2026 is $10.60 at the midpoint, missing analyst estimates by 1.2%
- Operating Margin: 11.7%, down from 13.4% in the same quarter last year
- Free Cash Flow Margin: 8.4%, down from 9.7% in the same quarter last year
- Locations: 2,159 at quarter end, up from 2,031 in the same quarter last year
- Same-Store Sales rose 4.6% year on year (0% in the same quarter last year)
- Market Capitalization: $26.07 billion
"We had a strong quarter with same-restaurant sales and earnings growth that exceeded our expectations," said Darden President & CEO Rick Cardenas.
Company Overview
Founded in 1968 as Red Lobster, Darden (NYSE: DRI) is a leading American restaurant company that owns and operates a portfolio of popular restaurant brands.
Revenue Growth
Examining a company’s long-term performance can provide clues about its quality. Any business can experience short-term success, but top-performing ones enjoy sustained growth for years.
With $12.08 billion in revenue over the past 12 months, Darden is one of the most widely recognized restaurant chains and benefits from customer loyalty, a luxury many don’t have. Its scale also gives it negotiating leverage with suppliers, enabling it to source its ingredients at a lower cost. However, its scale is a double-edged sword because there is only so much real estate to build restaurants, placing a ceiling on its growth. For Darden to boost its sales, it likely needs to adjust its prices, launch new chains, or lean into foreign markets.
As you can see below, Darden’s sales grew at a mediocre 6% compounded annual growth rate over the last six years (we compare to 2019 to normalize for COVID-19 impacts) as it barely increased sales at existing, established dining locations.
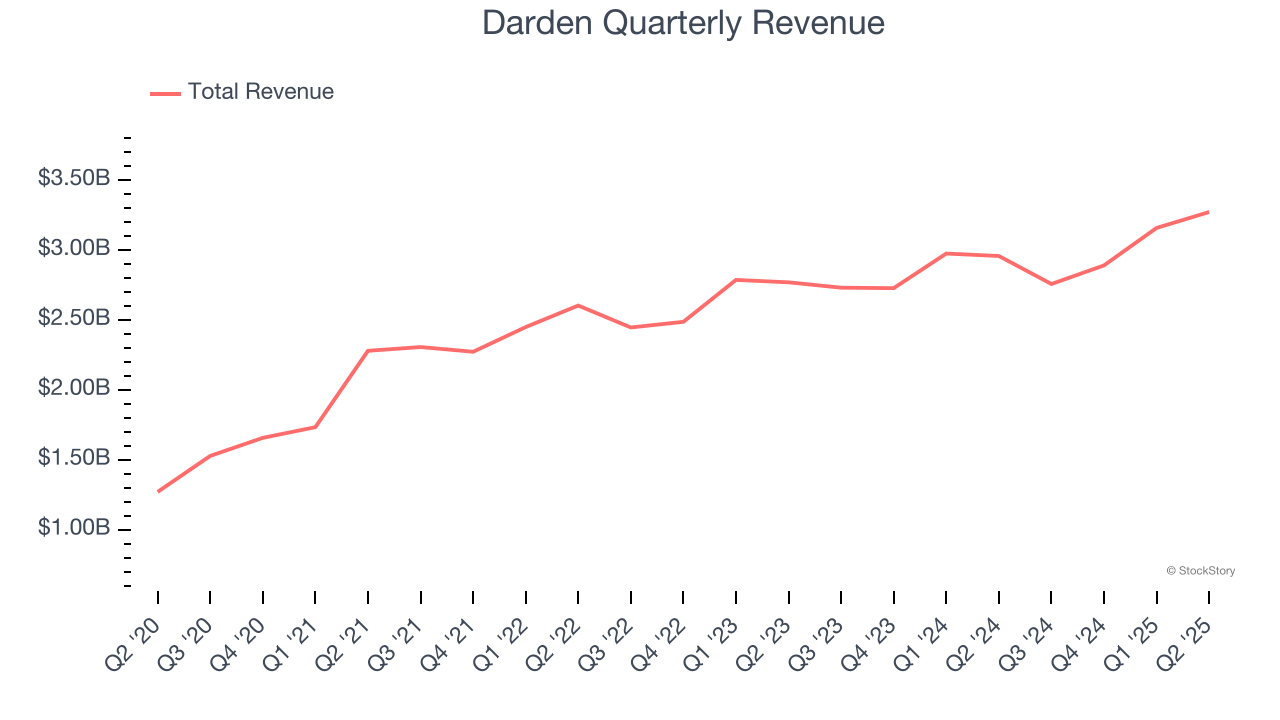
This quarter, Darden’s year-on-year revenue growth was 10.6%, and its $3.27 billion of revenue was in line with Wall Street’s estimates.
Looking ahead, sell-side analysts expect revenue to grow 8.7% over the next 12 months, an acceleration versus the last six years. This projection is above average for the sector and indicates its newer menu offerings will catalyze better top-line performance.
Here at StockStory, we certainly understand the potential of thematic investing. Diverse winners from Microsoft (MSFT) to Alphabet (GOOG), Coca-Cola (KO) to Monster Beverage (MNST) could all have been identified as promising growth stories with a megatrend driving the growth. So, in that spirit, we’ve identified a relatively under-the-radar profitable growth stock benefiting from the rise of AI, available to you FREE via this link.
Restaurant Performance
Number of Restaurants
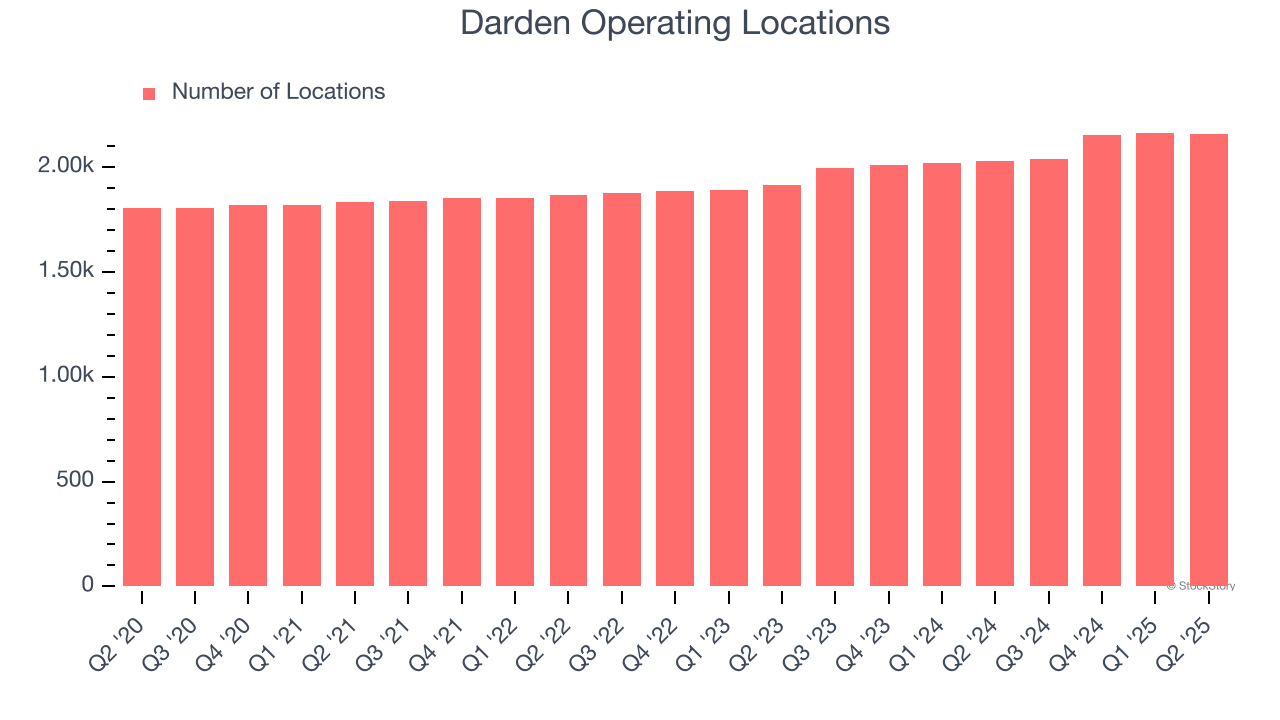
Darden sported 2,159 locations in the latest quarter. Over the last two years, it has opened new restaurants at a rapid clip by averaging 6.1% annual growth, among the fastest in the restaurant sector.
When a chain opens new restaurants, it usually means it’s investing for growth because there’s healthy demand for its meals and there are markets where its concepts have few or no locations.
Same-Store Sales
The change in a company's restaurant base only tells one side of the story. The other is the performance of its existing locations, which informs management teams whether they should expand or downsize their physical footprints. Same-store sales is an industry measure of whether revenue is growing at those existing restaurants and is driven by customer visits (often called traffic) and the average spending per customer (ticket).
Darden’s demand within its existing dining locations has been relatively stable over the last two years but was below most restaurant chains. On average, the company’s same-store sales have grown by 1.7% per year. This performance suggests it should consider improving its foot traffic and efficiency before expanding its restaurant base.
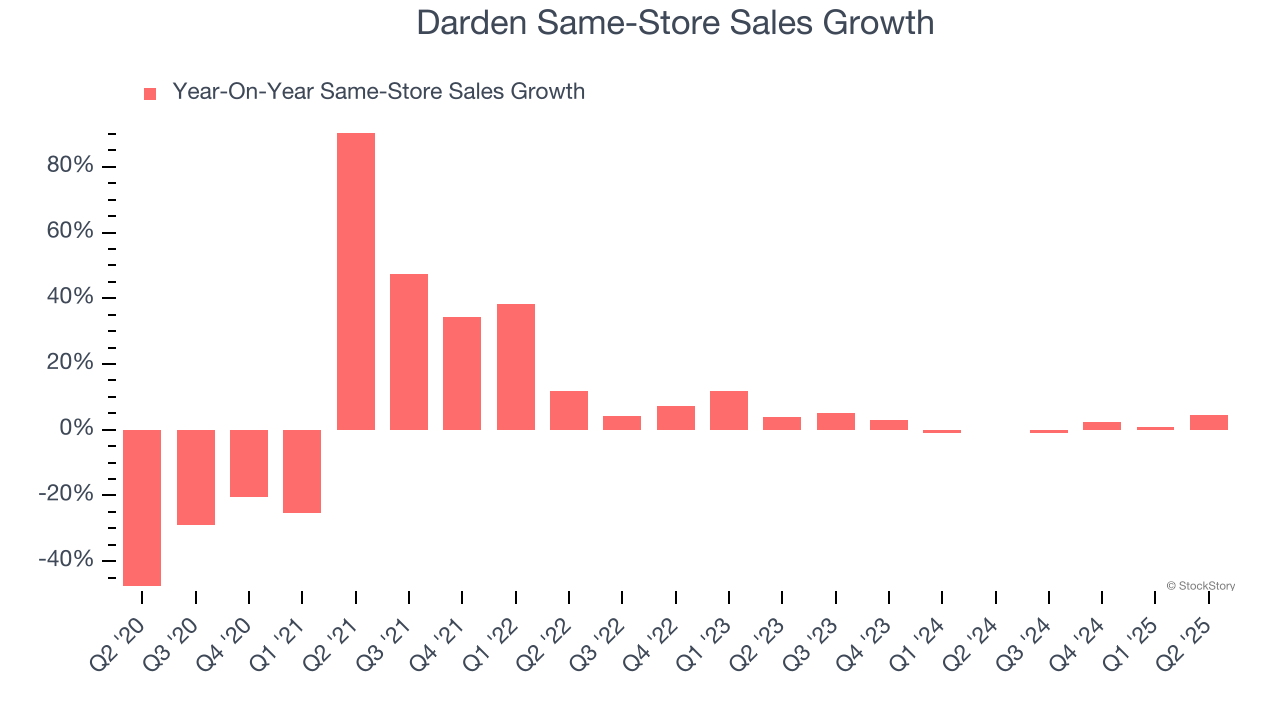
In the latest quarter, Darden’s same-store sales rose 4.6% year on year. This growth was an acceleration from its historical levels, which is always an encouraging sign.
Key Takeaways from Darden’s Q2 Results
We enjoyed seeing Darden beat analysts’ same-store sales expectations this quarter. We were also happy its revenue was in line with Wall Street’s estimates. On the other hand, its EPS fell short of Wall Street’s estimates. Looking ahead, EPS guidance also came in below expectations. Overall, this was a weaker quarter. The stock remained flat at $221 immediately following the results.
The latest quarter from Darden’s wasn’t that good. One earnings report doesn’t define a company’s quality, though, so let’s explore whether the stock is a buy at the current price. We think that the latest quarter is only one piece of the longer-term business quality puzzle. Quality, when combined with valuation, can help determine if the stock is a buy. We cover that in our actionable full research report which you can read here, it’s free.