
Texas Roadhouse currently trades at $193.37 and has been a dream stock for shareholders. It’s returned 275% since June 2020, tripling the S&P 500’s 92.3% gain. The company has also beaten the index over the past six months as its stock price is up 6.6%.
Is now still a good time to buy TXRH? Or is this a case of a company fueled by heightened investor enthusiasm? Find out in our full research report, it’s free.
Why Is TXRH a Good Business?
With locations often featuring Western-inspired decor, Texas Roadhouse (NASDAQ: TXRH) is an American restaurant chain specializing in Southern-style cuisine and steaks.
1. Restaurant Growth Signals an Offensive Strategy
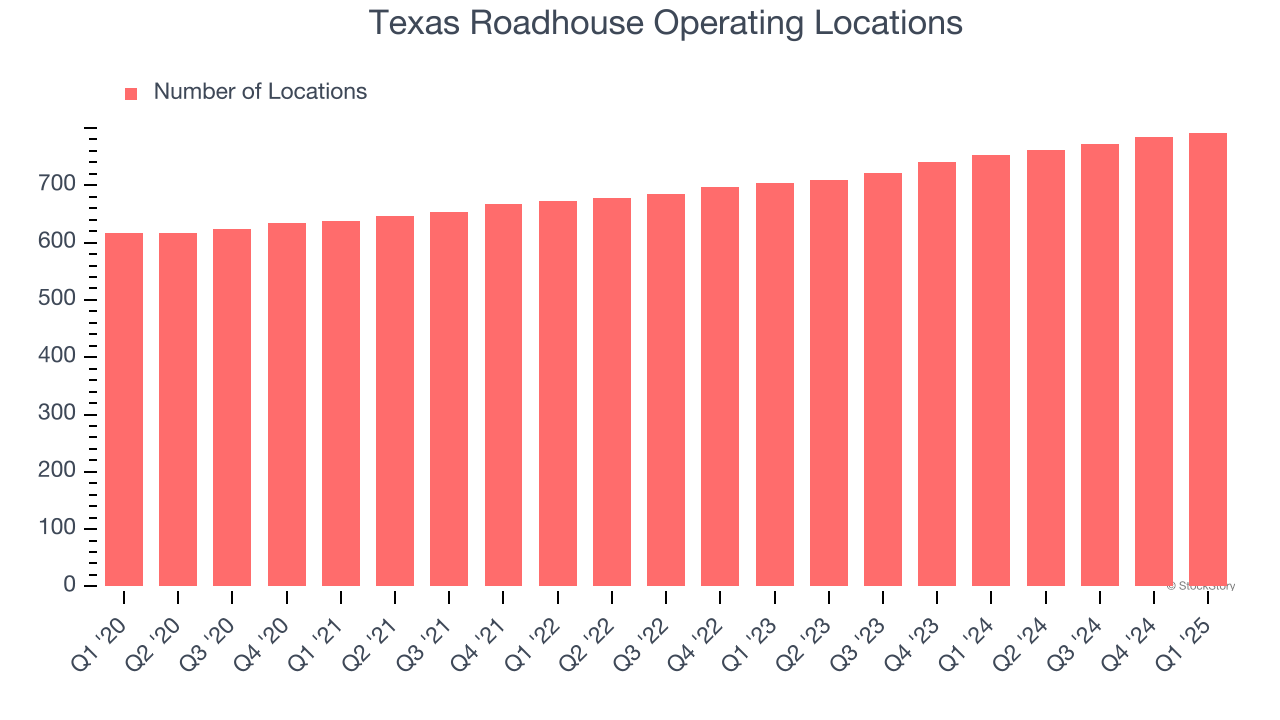
The number of dining locations a restaurant chain operates is a critical driver of how quickly company-level sales can grow.
Texas Roadhouse operated 792 locations in the latest quarter. It has opened new restaurants at a rapid clip over the last two years, averaging 6.1% annual growth, much faster than the broader restaurant sector.
When a chain opens new restaurants, it usually means it’s investing for growth because there’s healthy demand for its meals and there are markets where its concepts have few or no locations.
2. Surging Same-Store Sales Show Increasing Demand
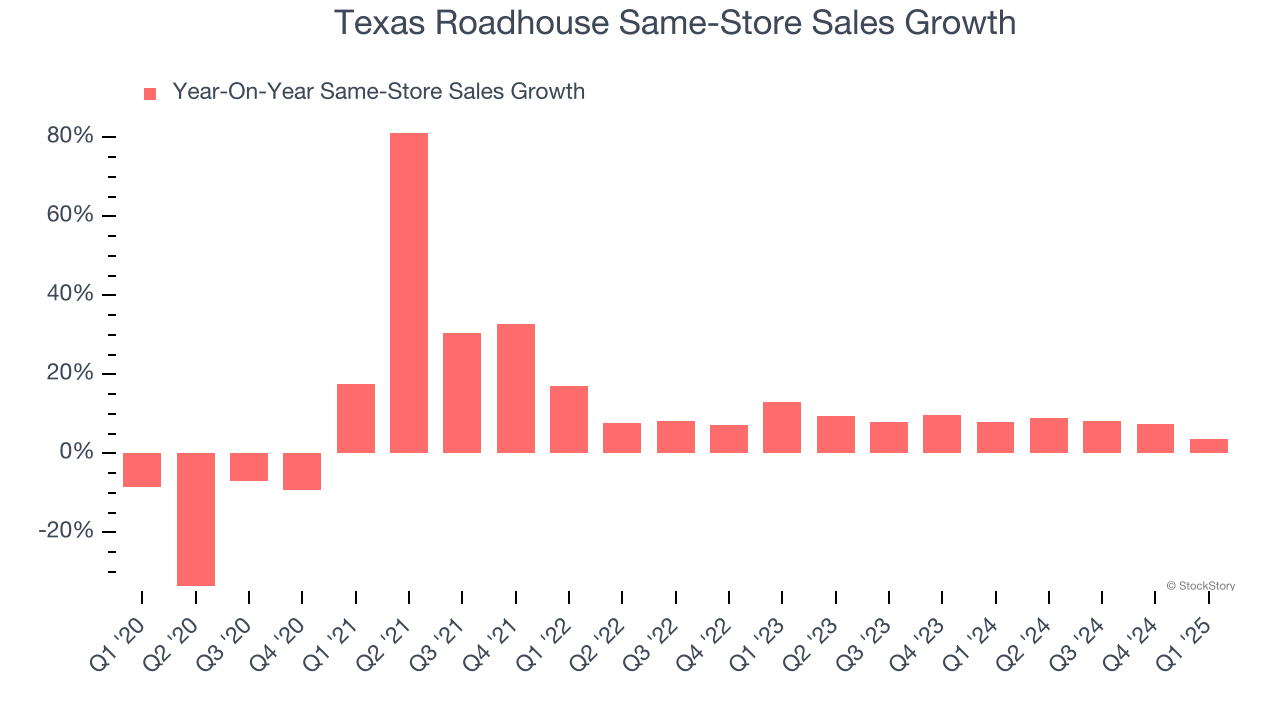
Same-store sales is an industry measure of whether revenue is growing at existing restaurants, and it is driven by customer visits (often called traffic) and the average spending per customer (ticket).
Texas Roadhouse has been one of the most successful restaurant chains over the last two years thanks to skyrocketing demand within its existing dining locations. On average, the company has posted exceptional year-on-year same-store sales growth of 7.9%.
3. Stellar ROIC Showcases Lucrative Growth Opportunities
Growth gives us insight into a company’s long-term potential, but how capital-efficient was that growth? A company’s ROIC explains this by showing how much operating profit it makes compared to the money it has raised (debt and equity).
Texas Roadhouse’s five-year average ROIC was 18.7%, placing it among the best restaurant companies. This illustrates its management team’s ability to invest in highly profitable ventures and produce tangible results for shareholders.
Final Judgment
These are just a few reasons why we're bullish on Texas Roadhouse, and with its shares beating the market recently, the stock trades at 27.3× forward P/E (or $193.37 per share). Is now a good time to buy? See for yourself in our comprehensive research report, it’s free.
Stocks We Like Even More Than Texas Roadhouse
The market surged in 2024 and reached record highs after Donald Trump’s presidential victory in November, but questions about new economic policies are adding much uncertainty for 2025.
While the crowd speculates what might happen next, we’re homing in on the companies that can succeed regardless of the political or macroeconomic environment. Put yourself in the driver’s seat and build a durable portfolio by checking out our Top 5 Strong Momentum Stocks for this week. This is a curated list of our High Quality stocks that have generated a market-beating return of 183% over the last five years (as of March 31st 2025).
Stocks that made our list in 2020 include now familiar names such as Nvidia (+1,545% between March 2020 and March 2025) as well as under-the-radar businesses like the once-micro-cap company Tecnoglass (+1,754% five-year return). Find your next big winner with StockStory today.