
Over the last six months, Valley National Bank’s shares have sunk to $8.65, producing a disappointing 5.6% loss - a stark contrast to the S&P 500’s 1.1% gain. This was partly driven by its softer quarterly results and might have investors contemplating their next move.
Is now the time to buy Valley National Bank, or should you be careful about including it in your portfolio? Dive into our full research report to see our analyst team’s opinion, it’s free.
Why Is Valley National Bank Not Exciting?
Despite the more favorable entry price, we don't have much confidence in Valley National Bank. Here are three reasons why VLY doesn't excite us and a stock we'd rather own.
1. Revenue Tumbling Downwards
Long-term growth is the most important, but within financials, a stretched historical view may miss recent interest rate changes and market returns. Valley National Bank’s recent performance marks a sharp pivot from its five-year trend as its revenue has shown annualized declines of 3.1% over the last two years. 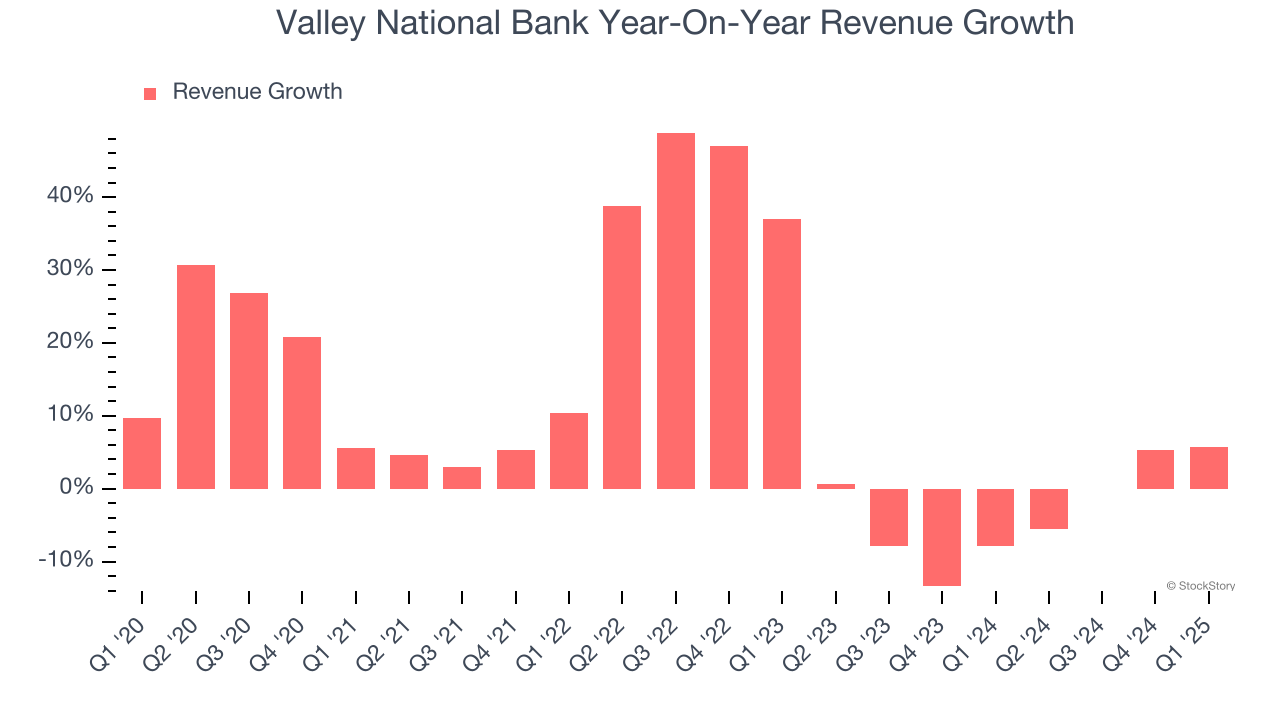
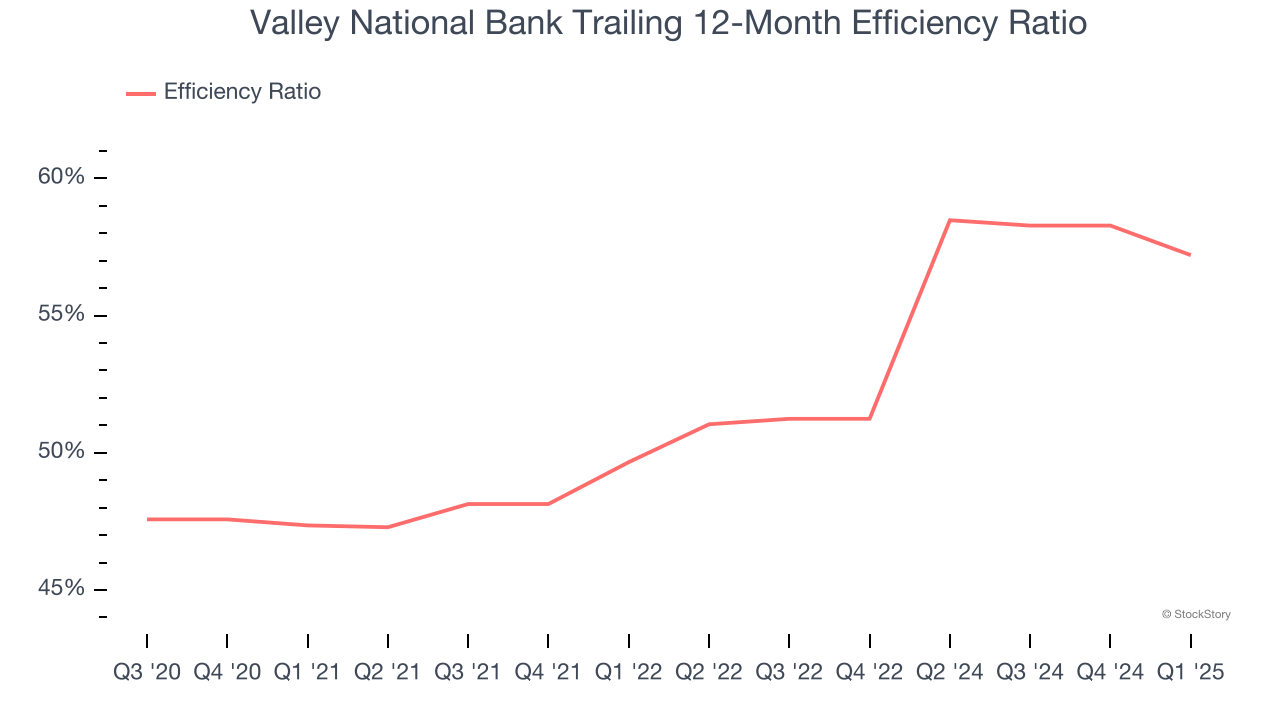
2. Deteriorating Efficiency Ratio
The underlying profitability of top-line growth determines the actual bottom-line impact. Banking institutions measure this dynamic using the efficiency ratio, which is calculated by dividing non-interest expenses like personnel, facilities, technology, and marketing by total revenue.
Investors focus on efficiency ratio changes rather than absolute levels, understanding that expense structures vary by revenue mix. Counterintuitively, lower efficiency ratios indicate better performance since they represent lower costs relative to revenue.
Over the last four years, Valley National Bank’s efficiency ratio has swelled by 9.9 percentage points, hitting 57.2% for the past 12 months. Said differently, the company’s expenses have increased at a faster rate than revenue, which is usually raises questions in mature industries (the exception is a high-growth company that reinvests its profits in attractive ventures).
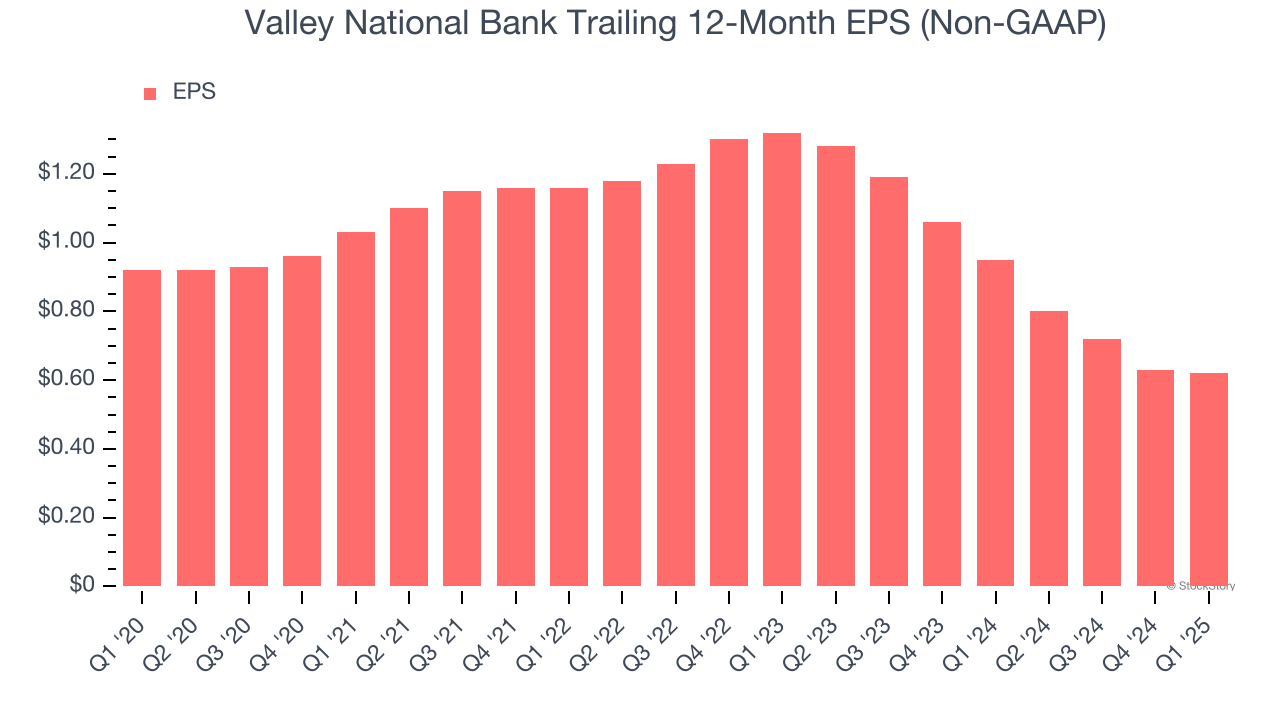
3. EPS Trending Down
Analyzing the long-term change in earnings per share (EPS) shows whether a company's incremental sales were profitable – for example, revenue could be inflated through excessive spending on advertising and promotions.
Sadly for Valley National Bank, its EPS declined by 7.6% annually over the last five years while its revenue grew by 11.3%. This tells us the company became less profitable on a per-share basis as it expanded.
Final Judgment
Valley National Bank isn’t a terrible business, but it isn’t one of our picks. After the recent drawdown, the stock trades at 0.6× forward P/B (or $8.65 per share). While this valuation is optically cheap, the potential downside is big given its shaky fundamentals. We're pretty confident there are more exciting stocks to buy at the moment. Let us point you toward a fast-growing restaurant franchise with an A+ ranch dressing sauce.
Stocks We Would Buy Instead of Valley National Bank
Donald Trump’s victory in the 2024 U.S. Presidential Election sent major indices to all-time highs, but stocks have retraced as investors debate the health of the economy and the potential impact of tariffs.
While this leaves much uncertainty around 2025, a few companies are poised for long-term gains regardless of the political or macroeconomic climate, like our Top 5 Strong Momentum Stocks for this week. This is a curated list of our High Quality stocks that have generated a market-beating return of 183% over the last five years (as of March 31st 2025).
Stocks that made our list in 2020 include now familiar names such as Nvidia (+1,545% between March 2020 and March 2025) as well as under-the-radar businesses like the once-micro-cap company Tecnoglass (+1,754% five-year return). Find your next big winner with StockStory today.