Over the past six months, Lennox’s shares (currently trading at $564.18) have posted a disappointing 10.6% loss while the S&P 500 was flat. This might have investors contemplating their next move.
Following the pullback, is this a buying opportunity for LII? Find out in our full research report, it’s free.
Why Does Lennox Spark Debate?
Based in Texas and founded over a century ago, Lennox (NYSE: LII) is a climate control solutions company offering heating, ventilation, air conditioning, and refrigeration (HVACR) goods.
Two Positive Attributes:
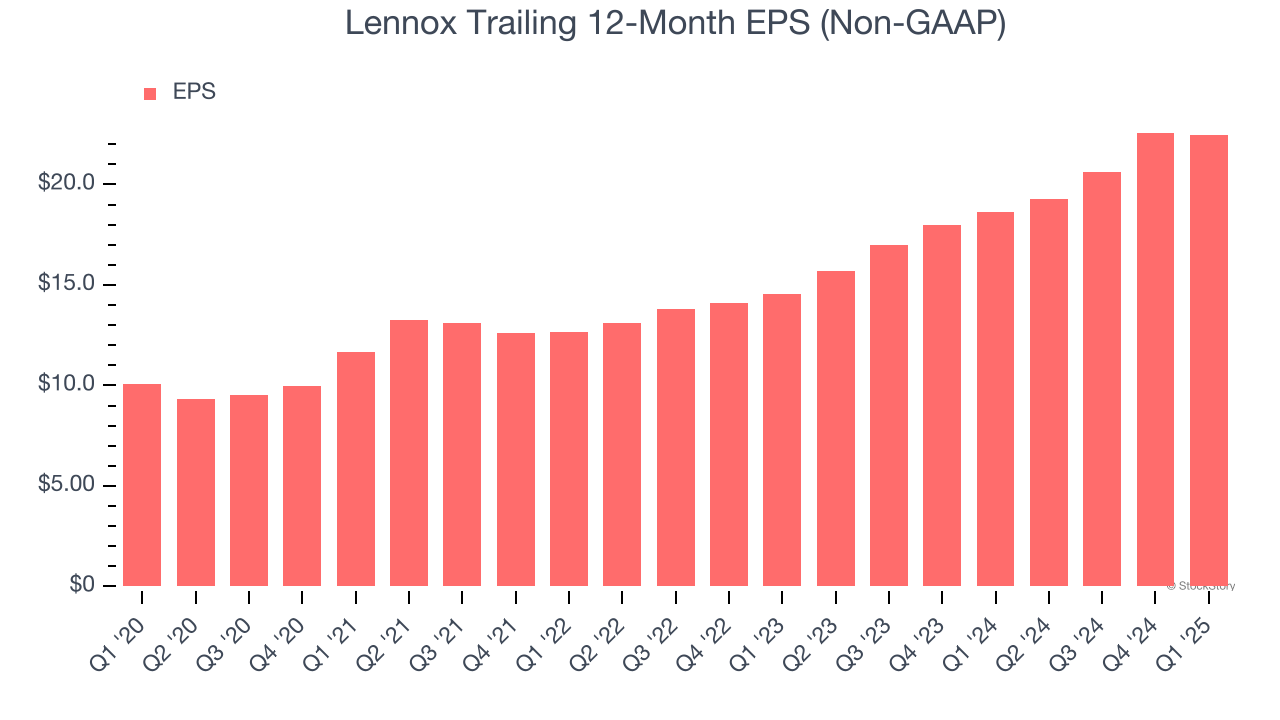
1. Outstanding Long-Term EPS Growth
We track the long-term change in earnings per share (EPS) because it highlights whether a company’s growth is profitable.
Lennox’s EPS grew at a spectacular 17.4% compounded annual growth rate over the last five years, higher than its 7.5% annualized revenue growth. This tells us the company became more profitable on a per-share basis as it expanded.
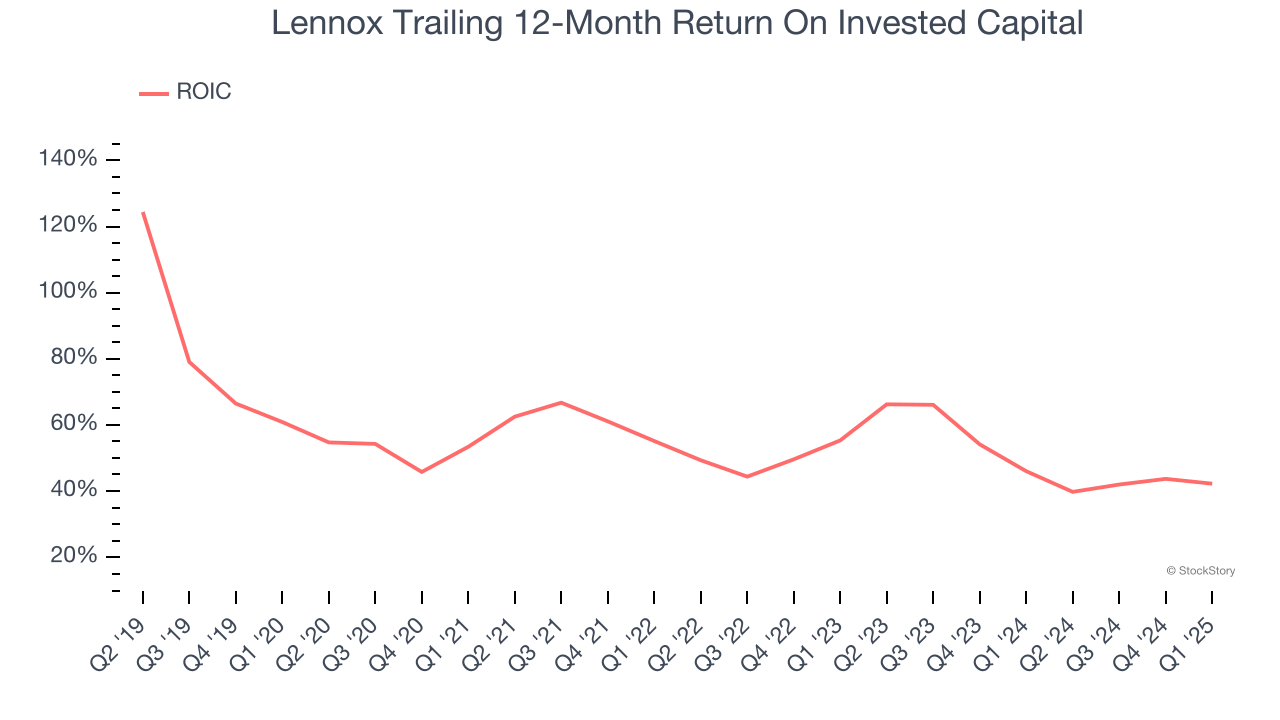
2. Stellar ROIC Showcases Lucrative Growth Opportunities
Growth gives us insight into a company’s long-term potential, but how capital-efficient was that growth? Enter ROIC, a metric showing how much operating profit a company generates relative to the money it has raised (debt and equity).
Lennox’s five-year average ROIC was 50.4%, placing it among the best industrials companies. This illustrates its management team’s ability to invest in highly profitable ventures and produce tangible results for shareholders.
One Reason to be Careful:
New Investments Fail to Bear Fruit as ROIC Declines
ROIC, or return on invested capital, is a metric showing how much operating profit a company generates relative to the money it has raised (debt and equity).
We like to invest in businesses with high returns, but the trend in a company’s ROIC is what often surprises the market and moves the stock price. Over the last few years, Lennox’s ROIC has unfortunately decreased significantly. Only time will tell if its new bets can bear fruit and potentially reverse the trend.

Final Judgment
Lennox’s positive characteristics outweigh the negatives. With the recent decline, the stock trades at 23.8× forward P/E (or $564.18 per share). Is now a good time to buy? See for yourself in our comprehensive research report, it’s free.
High-Quality Stocks for All Market Conditions
Market indices reached historic highs following Donald Trump’s presidential victory in November 2024, but the outlook for 2025 is clouded by new trade policies that could impact business confidence and growth.
While this has caused many investors to adopt a "fearful" wait-and-see approach, we’re leaning into our best ideas that can grow regardless of the political or macroeconomic climate. Take advantage of Mr. Market by checking out our Top 6 Stocks for this week. This is a curated list of our High Quality stocks that have generated a market-beating return of 183% over the last five years (as of March 31st 2025).
Stocks that made our list in 2020 include now familiar names such as Nvidia (+1,545% between March 2020 and March 2025) as well as under-the-radar businesses like the once-micro-cap company Tecnoglass (+1,754% five-year return). Find your next big winner with StockStory today.