Cruise ship company Carnival (NYSE: CCL) beat Wall Street’s revenue expectations in Q2 CY2025, with sales up 9.5% year on year to $6.33 billion. Its non-GAAP profit of $0.35 per share was 45.3% above analysts’ consensus estimates.
Is now the time to buy Carnival? Find out by accessing our full research report, it’s free.
Carnival (CCL) Q2 CY2025 Highlights:
- Revenue: $6.33 billion vs analyst estimates of $6.22 billion (9.5% year-on-year growth, 1.7% beat)
- Adjusted EPS: $0.35 vs analyst estimates of $0.24 (45.3% beat)
- Adjusted EBITDA: $1.51 billion vs analyst estimates of $1.36 billion (23.8% margin, 10.8% beat)
- Management raised its full-year Adjusted EPS guidance to $1.97 at the midpoint, a 7.7% increase
- EBITDA guidance for the full year is $6.9 billion at the midpoint, above analyst estimates of $6.74 billion
- Operating Margin: 14.8%, up from 9.7% in the same quarter last year
- Free Cash Flow Margin: 51.2%, up from 12.5% in the same quarter last year
- Passenger Cruise Days: 25.3 million, up 1 million year on year
- Market Capitalization: $31.07 billion
Company Overview
Boasting outrageous amenities like a planetarium on board its ships, Carnival (NYSE: CCL) is one of the world's largest leisure travel companies and a prominent player in the cruise industry.
Revenue Growth
A company’s long-term sales performance can indicate its overall quality. Any business can put up a good quarter or two, but many enduring ones grow for years. Unfortunately, Carnival’s 9% annualized revenue growth over the last five years was tepid. This was below our standard for the consumer discretionary sector and is a tough starting point for our analysis.
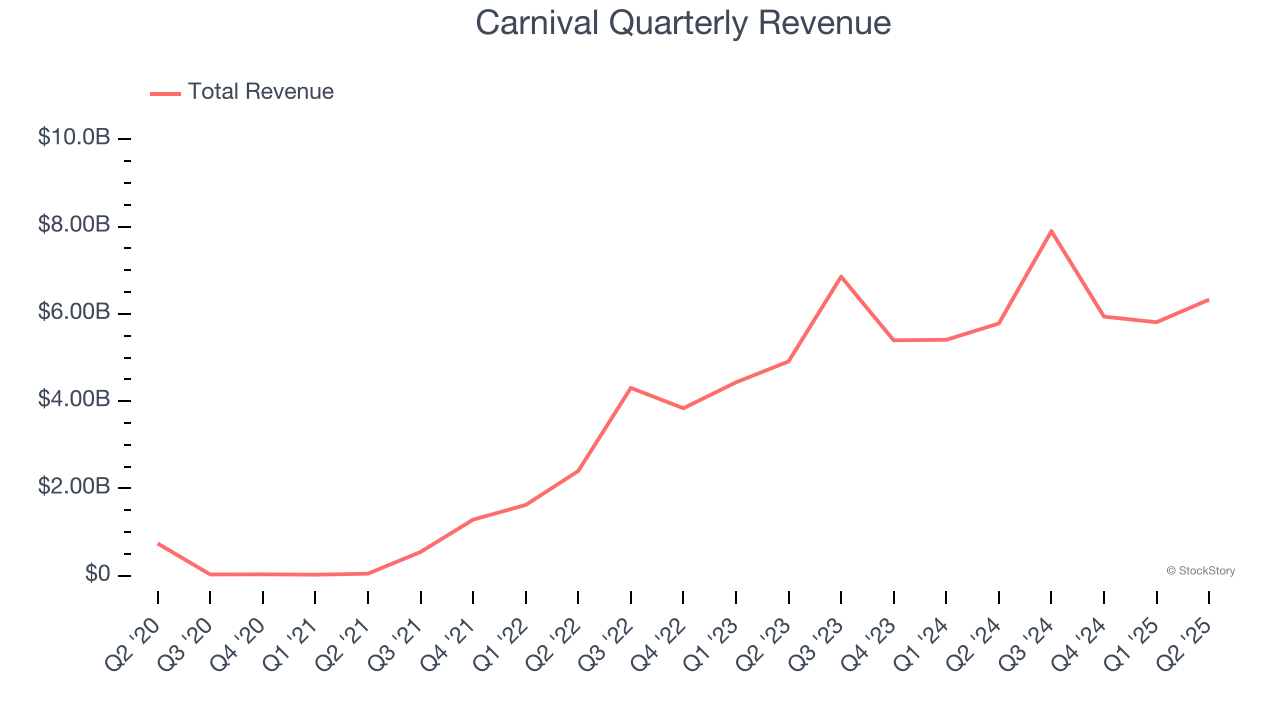
We at StockStory place the most emphasis on long-term growth, but within consumer discretionary, a stretched historical view may miss a company riding a successful new property or trend. Carnival’s annualized revenue growth of 21.9% over the last two years is above its five-year trend, suggesting its demand recently accelerated. Note that COVID hurt Carnival’s business in 2020 and part of 2021, and it bounced back in a big way thereafter. 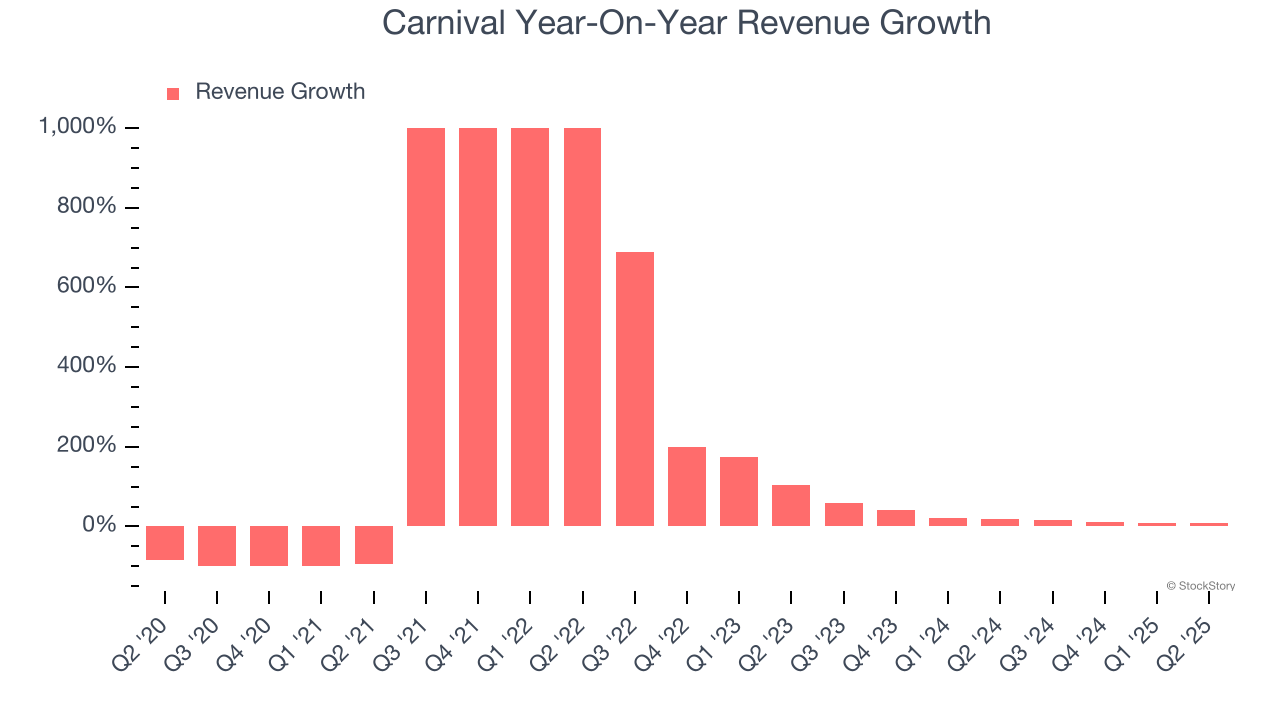
We can better understand the company’s revenue dynamics by analyzing its number of passenger cruise days, which reached 25.3 million in the latest quarter. Over the last two years, Carnival’s passenger cruise days averaged 15.4% year-on-year growth. Because this number is lower than its revenue growth during the same period, we can see the company’s monetization has risen. 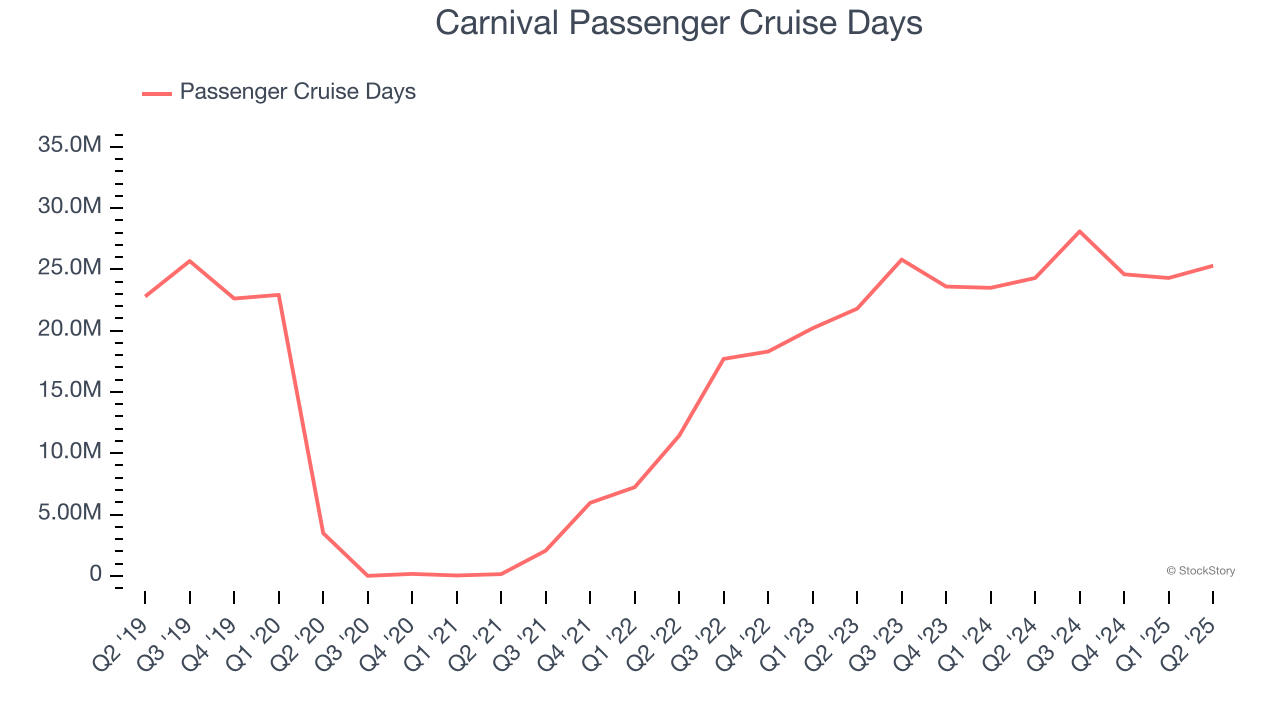
This quarter, Carnival reported year-on-year revenue growth of 9.5%, and its $6.33 billion of revenue exceeded Wall Street’s estimates by 1.7%.
Looking ahead, sell-side analysts expect revenue to grow 2.3% over the next 12 months, a deceleration versus the last two years. This projection doesn't excite us and indicates its products and services will see some demand headwinds.
Here at StockStory, we certainly understand the potential of thematic investing. Diverse winners from Microsoft (MSFT) to Alphabet (GOOG), Coca-Cola (KO) to Monster Beverage (MNST) could all have been identified as promising growth stories with a megatrend driving the growth. So, in that spirit, we’ve identified a relatively under-the-radar profitable growth stock benefiting from the rise of AI, available to you FREE via this link.
Operating Margin
Carnival’s operating margin has been trending up over the last 12 months and averaged 14.3% over the last two years. Its solid profitability for a consumer discretionary business shows it’s an efficient company that manages its expenses effectively.
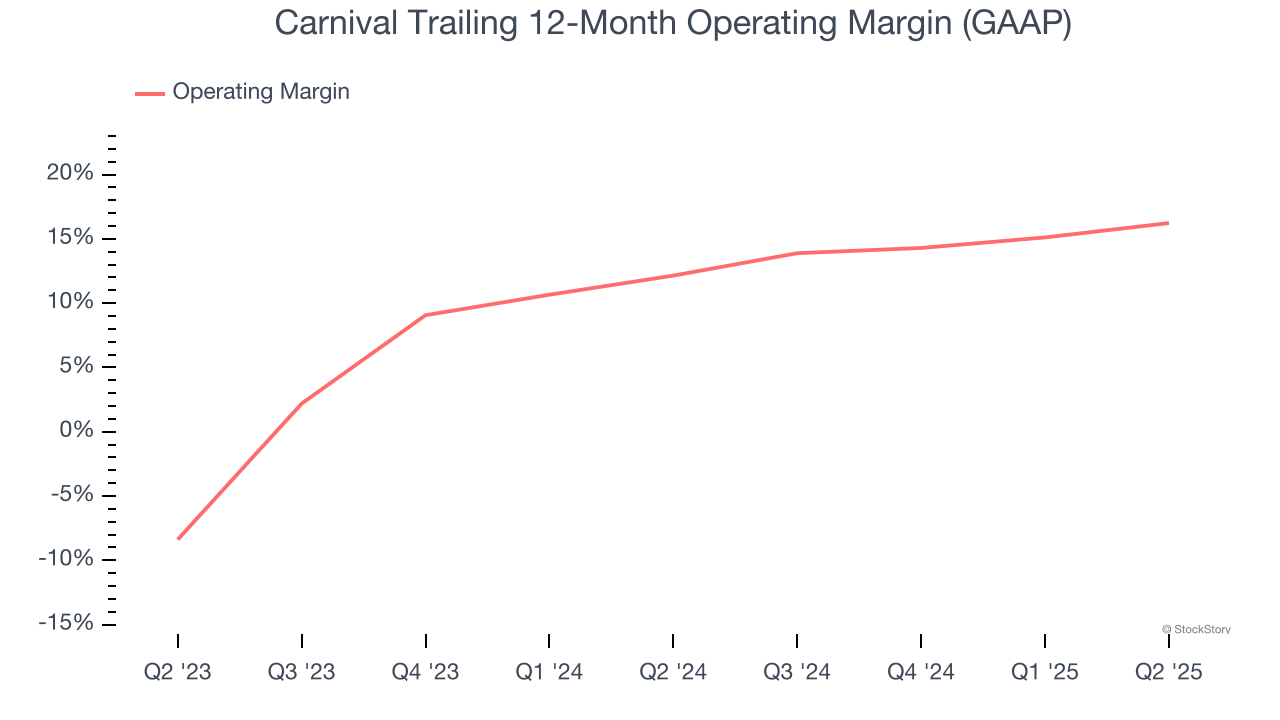
This quarter, Carnival generated an operating margin profit margin of 14.8%, up 5.1 percentage points year on year. This increase was a welcome development and shows it was more efficient.
Earnings Per Share
Revenue trends explain a company’s historical growth, but the long-term change in earnings per share (EPS) points to the profitability of that growth – for example, a company could inflate its sales through excessive spending on advertising and promotions.
Carnival’s EPS grew at an astounding 61.9% compounded annual growth rate over the last five years, higher than its 9% annualized revenue growth. This tells us the company became more profitable on a per-share basis as it expanded.
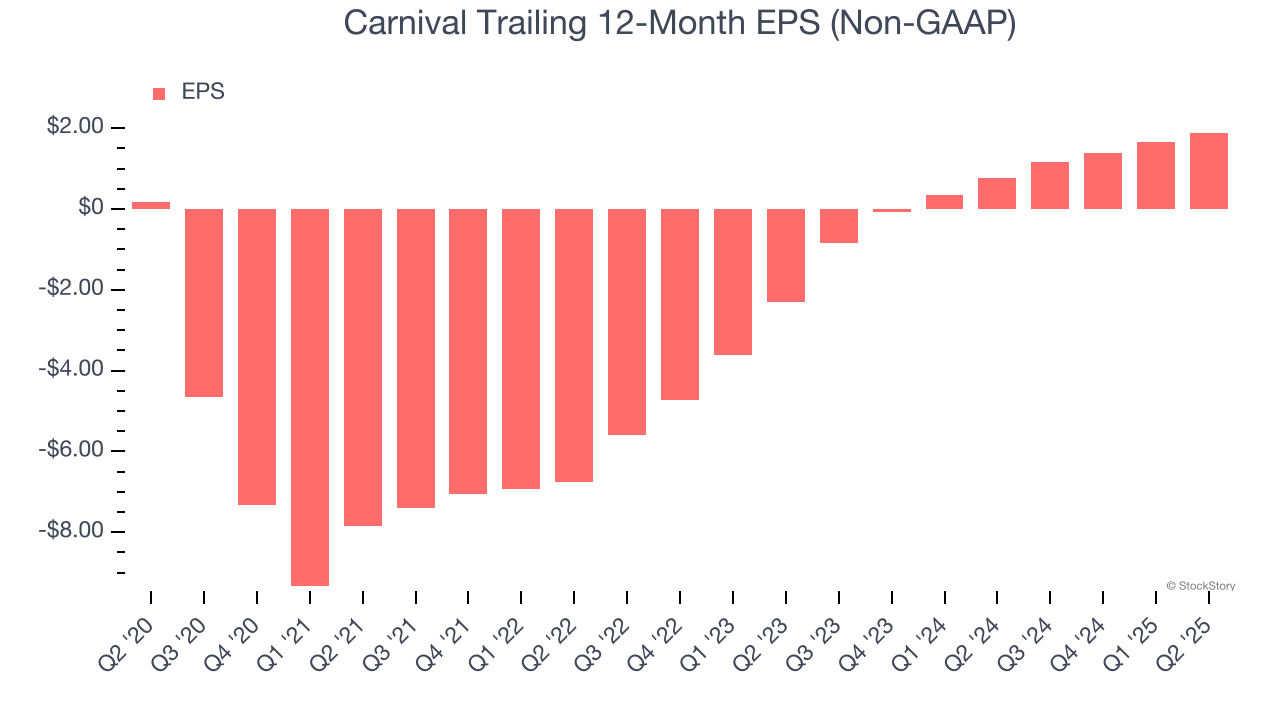
In Q2, Carnival reported EPS at $0.35, up from $0.11 in the same quarter last year. This print easily cleared analysts’ estimates, and shareholders should be content with the results. Over the next 12 months, Wall Street expects Carnival’s full-year EPS of $1.89 to grow 5.7%.
Key Takeaways from Carnival’s Q2 Results
We were impressed by how significantly Carnival blew past analysts’ EPS and EBITDA expectations this quarter. We were also happy it raised its full-year earnings guidance. Overall, we think this was a solid quarter with some key metrics above expectations. The stock traded up 5.7% to $25.40 immediately following the results.
Carnival put up rock-solid earnings, but one quarter doesn’t necessarily make the stock a buy. Let’s see if this is a good investment. The latest quarter does matter, but not nearly as much as longer-term fundamentals and valuation, when deciding if the stock is a buy. We cover that in our actionable full research report which you can read here, it’s free.