
Over the past six months, Franklin BSP Realty Trust’s shares (currently trading at $11.25) have posted a disappointing 11.8% loss while the S&P 500 was flat. This was partly driven by its softer quarterly results and may have investors wondering how to approach the situation.
Is there a buying opportunity in Franklin BSP Realty Trust, or does it present a risk to your portfolio? Dive into our full research report to see our analyst team’s opinion, it’s free.
Why Do We Think Franklin BSP Realty Trust Will Underperform?
Despite the more favorable entry price, we're sitting this one out for now. Here are three reasons why we avoid FBRT and a stock we'd rather own.
1. Revenue Tumbling Downwards
We at StockStory place the most emphasis on long-term growth, but within financials, a stretched historical view may miss recent interest rate changes, market returns, and industry trends. Franklin BSP Realty Trust’s recent performance marks a sharp pivot from its four-year trend as its revenue has shown annualized declines of 3.4% over the last two years. 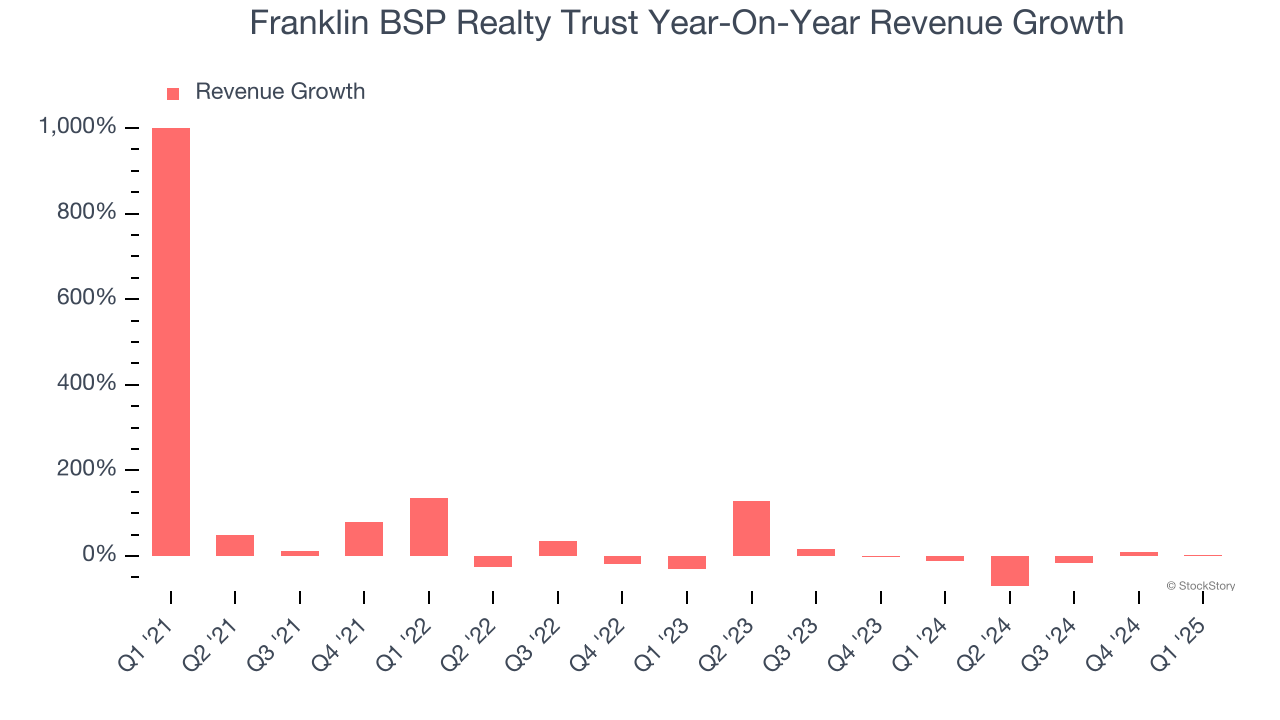
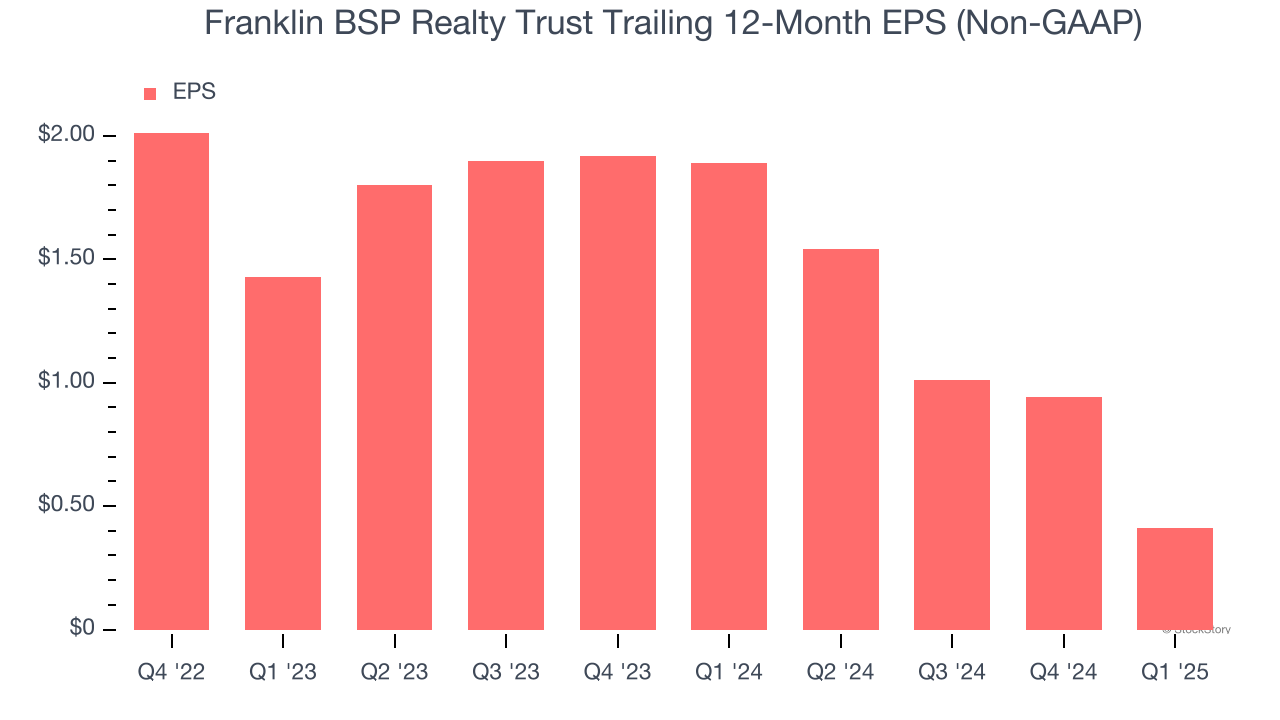
2. EPS Trending Down
We track the change in earnings per share (EPS) because it highlights whether a company’s growth is profitable.
Franklin BSP Realty Trust’s full-year EPS dropped significantly over the last two years. We tend to steer our readers away from companies with falling revenue and EPS, where diminishing earnings could imply changing secular trends and preferences. If the tide turns unexpectedly, Franklin BSP Realty Trust’s low margin of safety could leave its stock price susceptible to large downswings.
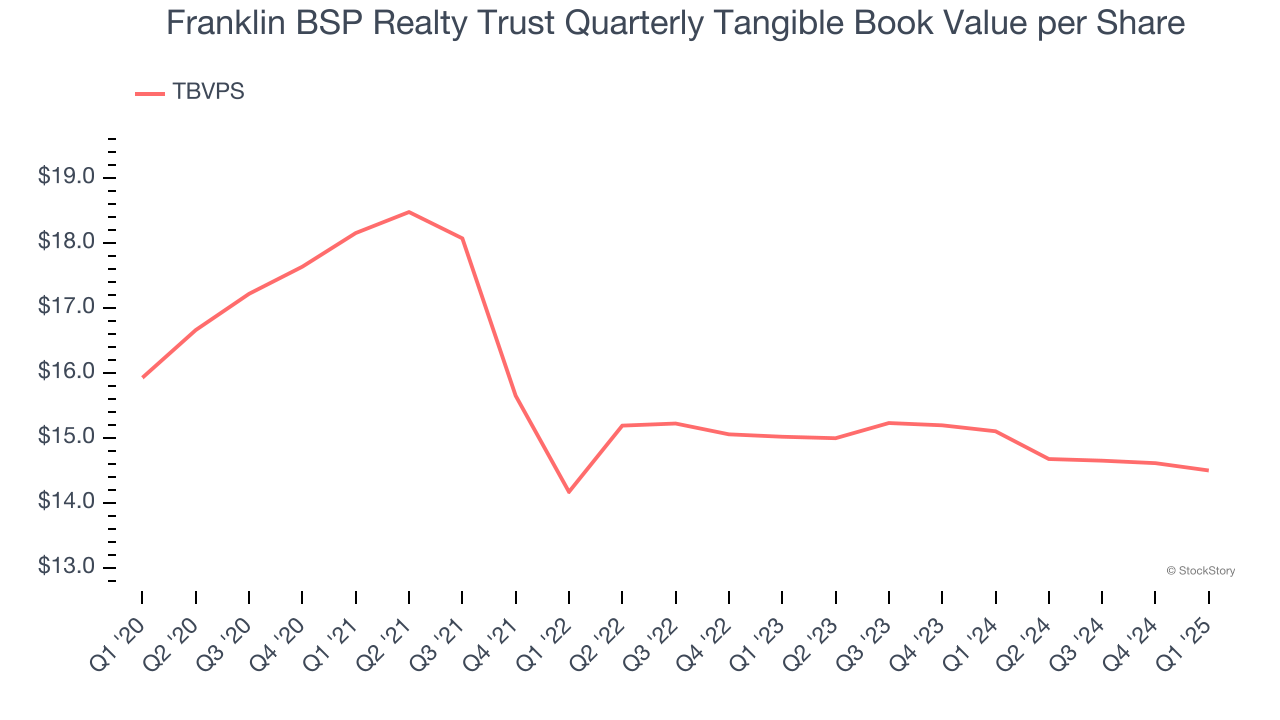
3. Declining TBVPS Reflects Erosion of Asset Value
For banks, tangible book value per share (TBVPS) is a crucial metric that measures the actual value of shareholders’ equity, stripping out goodwill and other intangible assets that may not be recoverable in a worst-case scenario.
Disappointingly for investors, Franklin BSP Realty Trust’s TBVPS declined at a 1.7% annual clip over the last two years.
Final Judgment
We see the value of companies driving economic growth, but in the case of Franklin BSP Realty Trust, we’re out. After the recent drawdown, the stock trades at 0.7× forward P/B (or $11.25 per share). While this valuation is optically cheap, the potential downside is huge given its shaky fundamentals. There are better investments elsewhere. We’d suggest looking at the Amazon and PayPal of Latin America.
High-Quality Stocks for All Market Conditions
The market surged in 2024 and reached record highs after Donald Trump’s presidential victory in November, but questions about new economic policies are adding much uncertainty for 2025.
While the crowd speculates what might happen next, we’re homing in on the companies that can succeed regardless of the political or macroeconomic environment. Put yourself in the driver’s seat and build a durable portfolio by checking out our Top 5 Strong Momentum Stocks for this week. This is a curated list of our High Quality stocks that have generated a market-beating return of 183% over the last five years (as of March 31st 2025).
Stocks that made our list in 2020 include now familiar names such as Nvidia (+1,545% between March 2020 and March 2025) as well as under-the-radar businesses like the once-small-cap company Exlservice (+354% five-year return). Find your next big winner with StockStory today.