Payroll and human resources software provider, Paychex (NASDAQ: PAYX) missed Wall Street’s revenue expectations in Q2 CY2025, but sales rose 10.2% year on year to $1.43 billion. Its GAAP profit of $0.82 per share decreased from $1.05 in the same quarter last year.
Is now the time to buy Paychex? Find out by accessing our full research report, it’s free.
Paychex (PAYX) Q2 CY2025 Highlights:
- Revenue: $1.43 billion vs analyst estimates of $1.44 billion (10.2% year-on-year growth, 1.1% miss)
- Operating Margin: 30.2%, down from 37.2% in the same quarter last year
- Free Cash Flow Margin: 23.4%, down from 44.2% in the previous quarter
- Market Capitalization: $54.84 billion
Company Overview
One of the oldest service providers in the industry, Paychex (NASDAQ: PAYX) offers its customers payroll and HR software solutions.
Revenue Growth
Examining a company’s long-term performance can provide clues about its quality. Even a bad business can shine for one or two quarters, but a top-tier one grows for years. Over the last three years, Paychex grew its sales at a weak 6.5% compounded annual growth rate. This wasn’t a great result compared to the rest of the software sector, but there are still things to like about Paychex.
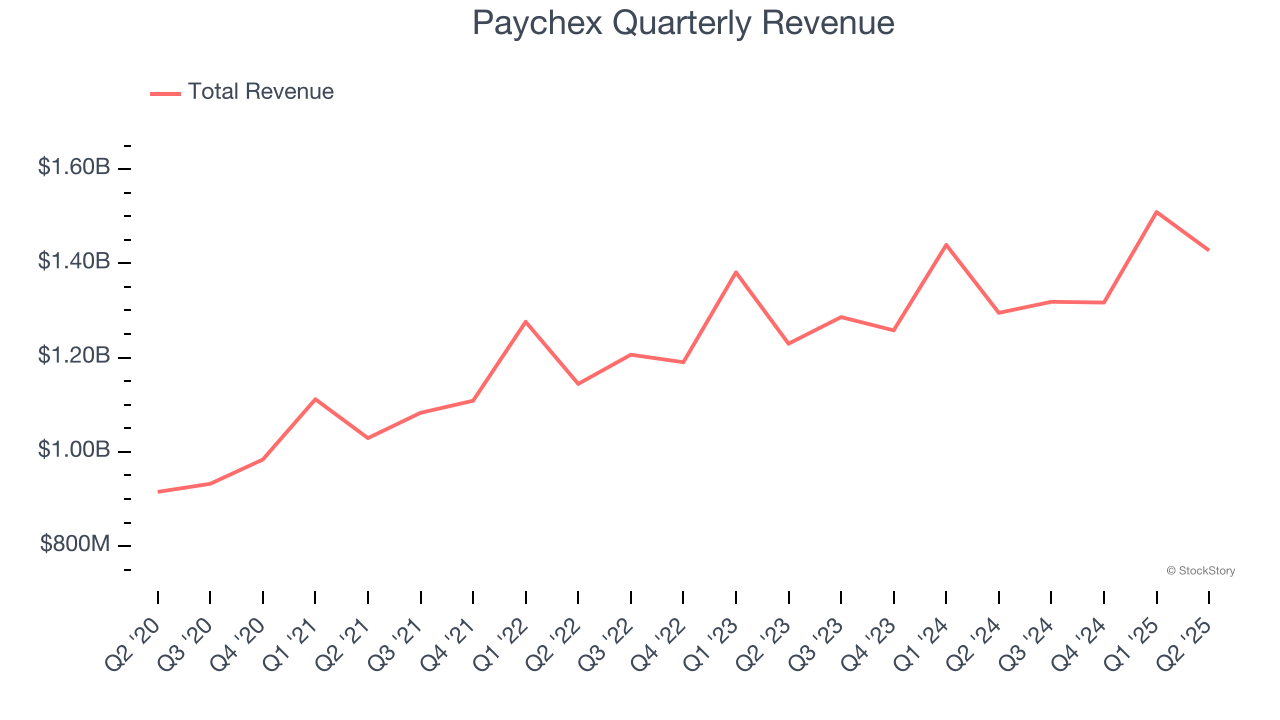
This quarter, Paychex’s revenue grew by 10.2% year on year to $1.43 billion but fell short of Wall Street’s estimates.
Looking ahead, sell-side analysts expect revenue to grow 18.7% over the next 12 months, an acceleration versus the last three years. This projection is admirable and indicates its newer products and services will catalyze better top-line performance.
Unless you’ve been living under a rock, it should be obvious by now that generative AI is going to have a huge impact on how large corporations do business. While Nvidia and AMD are trading close to all-time highs, we prefer a lesser-known (but still profitable) stock benefiting from the rise of AI. Click here to access our free report one of our favorites growth stories.
Cash Is King
Free cash flow isn't a prominently featured metric in company financials and earnings releases, but we think it's telling because it accounts for all operating and capital expenses, making it tough to manipulate. Cash is king.
Paychex has shown terrific cash profitability, enabling it to reinvest, return capital to investors, and stay ahead of the competition while maintaining an ample cushion. The company’s free cash flow margin was among the best in the software sector, averaging an eye-popping 31.6% over the last year.
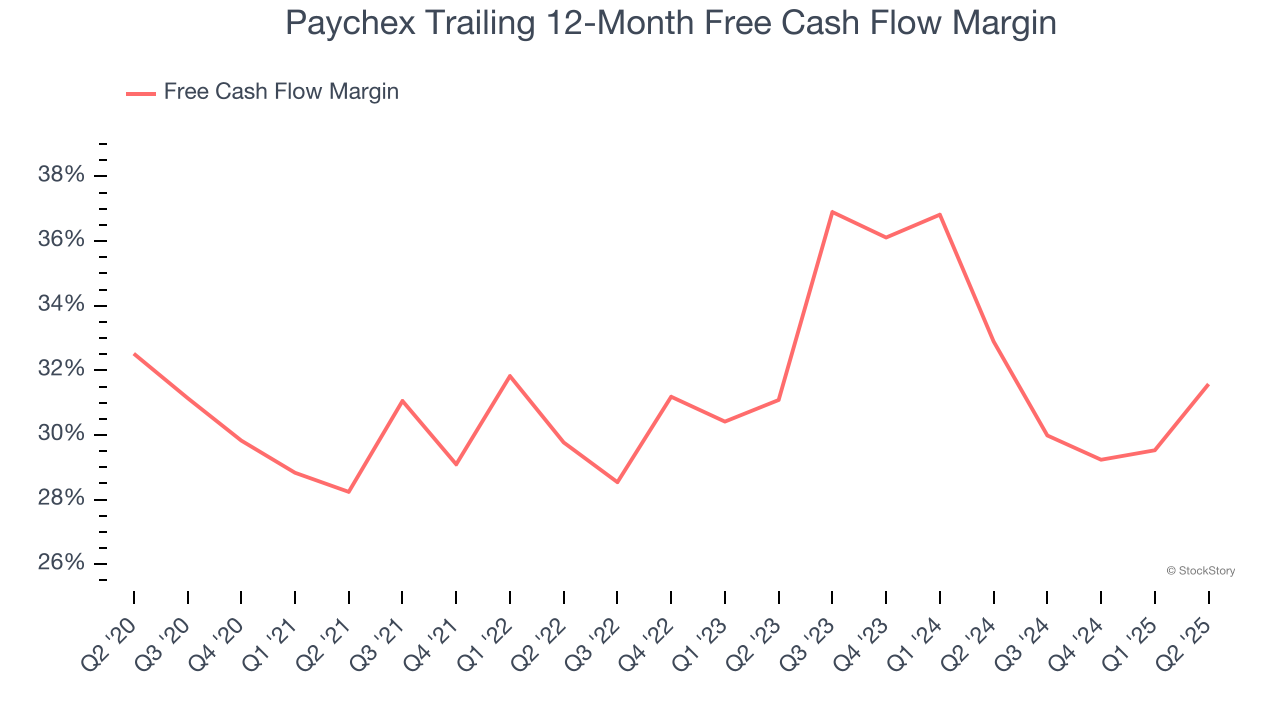
Paychex’s free cash flow clocked in at $333.5 million in Q2, equivalent to a 23.4% margin. This result was good as its margin was 9.4 percentage points higher than in the same quarter last year, but we note it was lower than its one-year cash profitability. Nevertheless, we wouldn’t read too much into a single quarter because investment needs can be seasonal, leading to short-term swings. Long-term trends are more important.
Over the next year, analysts predict Paychex’s cash conversion will improve. Their consensus estimates imply its free cash flow margin of 31.6% for the last 12 months will increase to 33.8%, it options for capital deployment (investments, share buybacks, etc.).
Key Takeaways from Paychex’s Q2 Results
We struggled to find many positives in these results. Revenue missed, and operating margin fell pretty significantly year-on-year. Overall, this was a weaker quarter. The stock traded down 2% to $149.25 immediately after reporting.
The latest quarter from Paychex’s wasn’t that good. One earnings report doesn’t define a company’s quality, though, so let’s explore whether the stock is a buy at the current price. If you’re making that decision, you should consider the bigger picture of valuation, business qualities, as well as the latest earnings. We cover that in our actionable full research report which you can read here, it’s free.