Over the last six months, KBR’s shares have sunk to $46.65, producing a disappointing 19.1% loss while the S&P 500 was flat. This might have investors contemplating their next move.
Given the weaker price action, is now a good time to buy KBR? Find out in our full research report, it’s free.
Why Does KBR Spark Debate?
Known for projects like the construction of Guantanamo Bay, KBR provides professional services and technologies, specializing in engineering, construction, and government services sectors.
Two Things to Like:
1. Encouraging Short-Term Revenue Growth
We at StockStory place the most emphasis on long-term growth, but within industrials, a stretched historical view may miss cycles, industry trends, or a company capitalizing on catalysts such as a new contract win or a successful product line. KBR’s annualized revenue growth of 10.3% over the last two years is above its five-year trend, suggesting its demand recently accelerated. 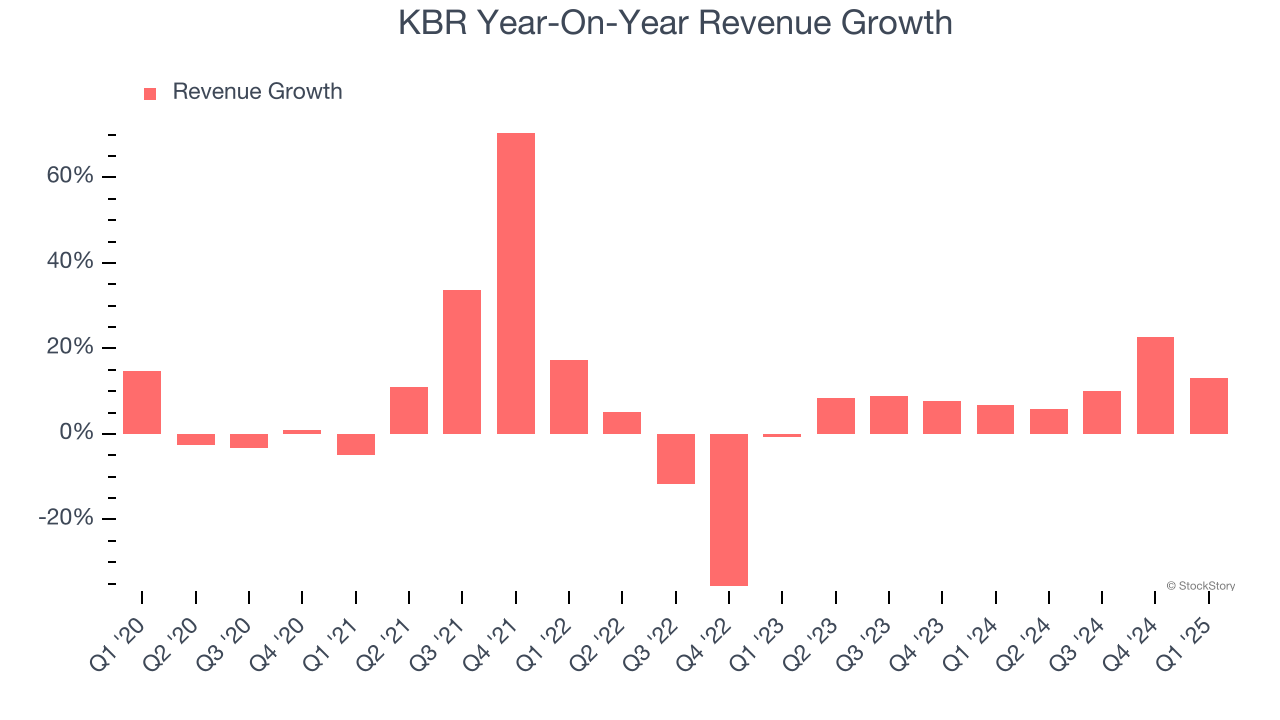
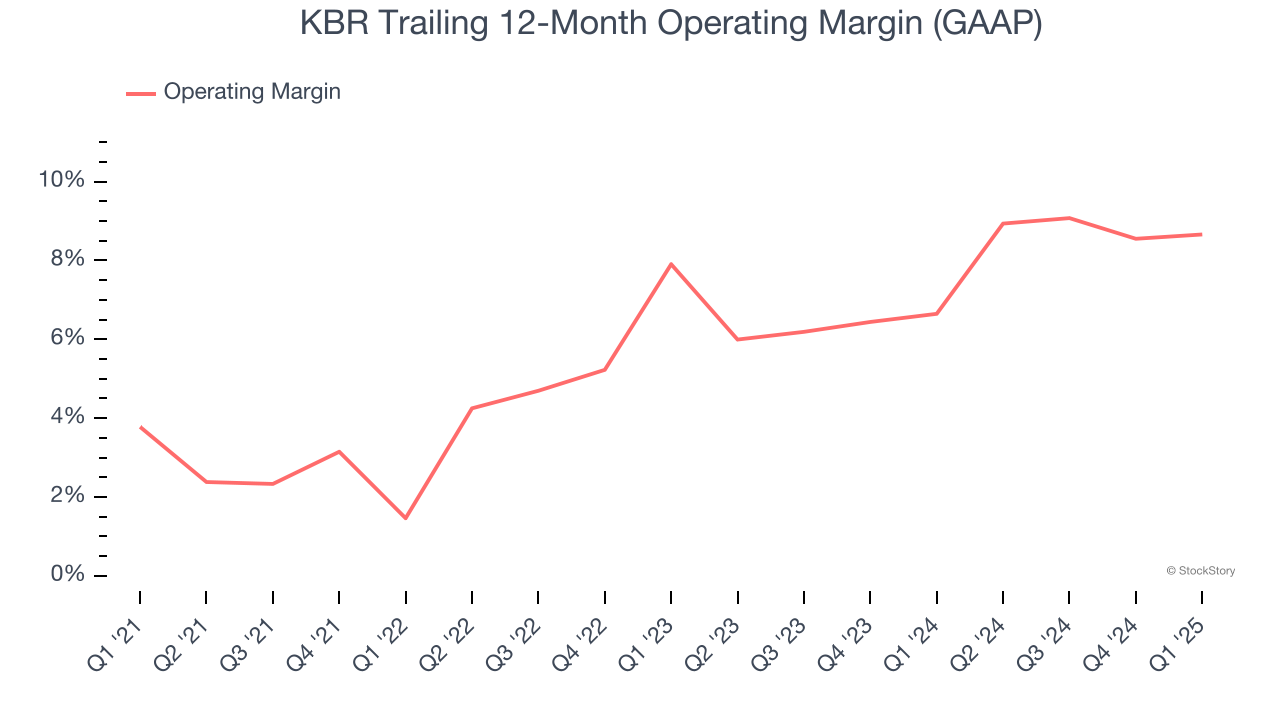
2. Operating Margin Rising, Profits Up
Operating margin is a key measure of profitability. Think of it as net income - the bottom line - excluding the impact of taxes and interest on debt, which are less connected to business fundamentals.
KBR’s operating margin rose by 4.9 percentage points over the last five years, as its sales growth gave it operating leverage. Its operating margin for the trailing 12 months was 8.7%.
One Reason to be Careful:
Weak Backlog Growth Points to Soft Demand
Investors interested in Defense Contractors companies should track backlog in addition to reported revenue. This metric shows the value of outstanding orders that have not yet been executed or delivered, giving visibility into KBR’s future revenue streams.
KBR’s backlog came in at $17.29 billion in the latest quarter, and over the last two years, its year-on-year growth averaged 5.2%. This performance was underwhelming and suggests that increasing competition is causing challenges in winning new orders. 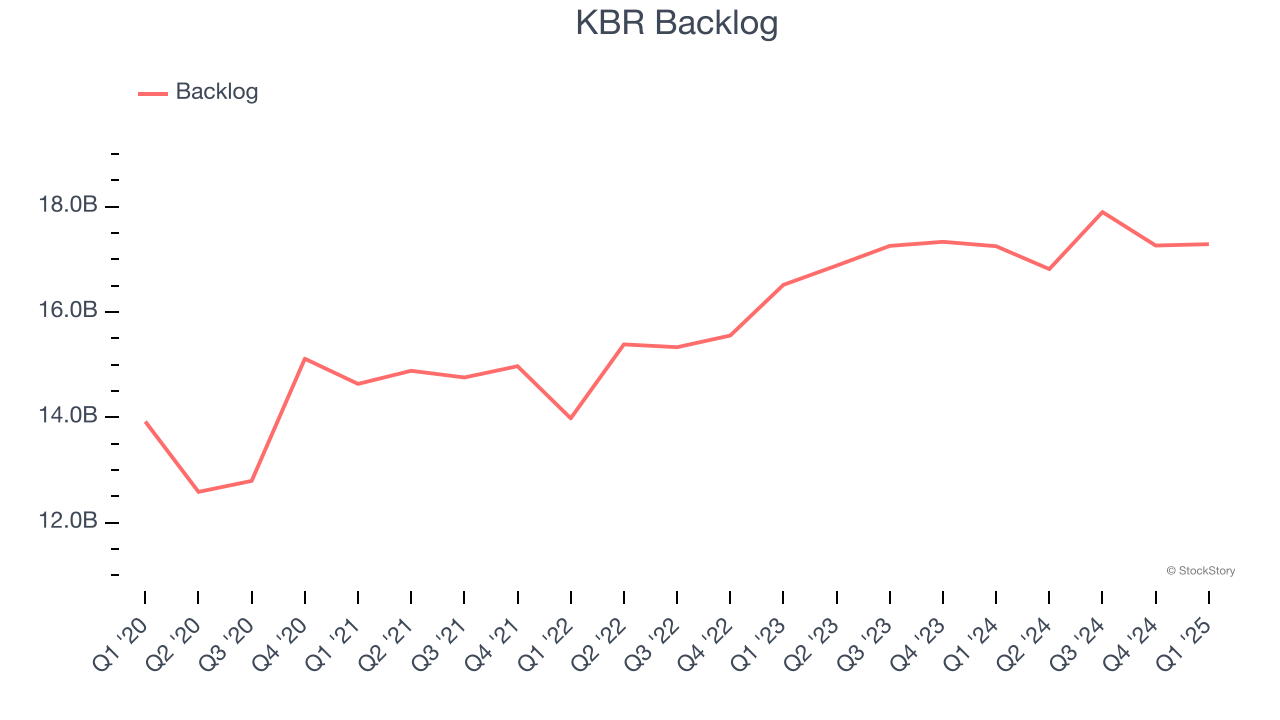
Final Judgment
KBR’s positive characteristics outweigh the negatives. After the recent drawdown, the stock trades at 12.5× forward P/E (or $46.65 per share). Is now a good time to initiate a position? See for yourself in our in-depth research report, it’s free.
Stocks We Like Even More Than KBR
Market indices reached historic highs following Donald Trump’s presidential victory in November 2024, but the outlook for 2025 is clouded by new trade policies that could impact business confidence and growth.
While this has caused many investors to adopt a "fearful" wait-and-see approach, we’re leaning into our best ideas that can grow regardless of the political or macroeconomic climate. Take advantage of Mr. Market by checking out our Top 5 Growth Stocks for this month. This is a curated list of our High Quality stocks that have generated a market-beating return of 183% over the last five years (as of March 31st 2025).
Stocks that made our list in 2020 include now familiar names such as Nvidia (+1,545% between March 2020 and March 2025) as well as under-the-radar businesses like the once-small-cap company Comfort Systems (+782% five-year return). Find your next big winner with StockStory today.