Over the last six months, Selective Insurance Group’s shares have sunk to $84.32, producing a disappointing 11.4% loss while the S&P 500 was flat. This was partly driven by its softer quarterly results and may have investors wondering how to approach the situation.
Is there a buying opportunity in Selective Insurance Group, or does it present a risk to your portfolio? Dive into our full research report to see our analyst team’s opinion, it’s free.
Why Is Selective Insurance Group Not Exciting?
Even with the cheaper entry price, we don't have much confidence in Selective Insurance Group. Here are three reasons why SIGI doesn't excite us and a stock we'd rather own.
1. Deteriorating Combined Ratio
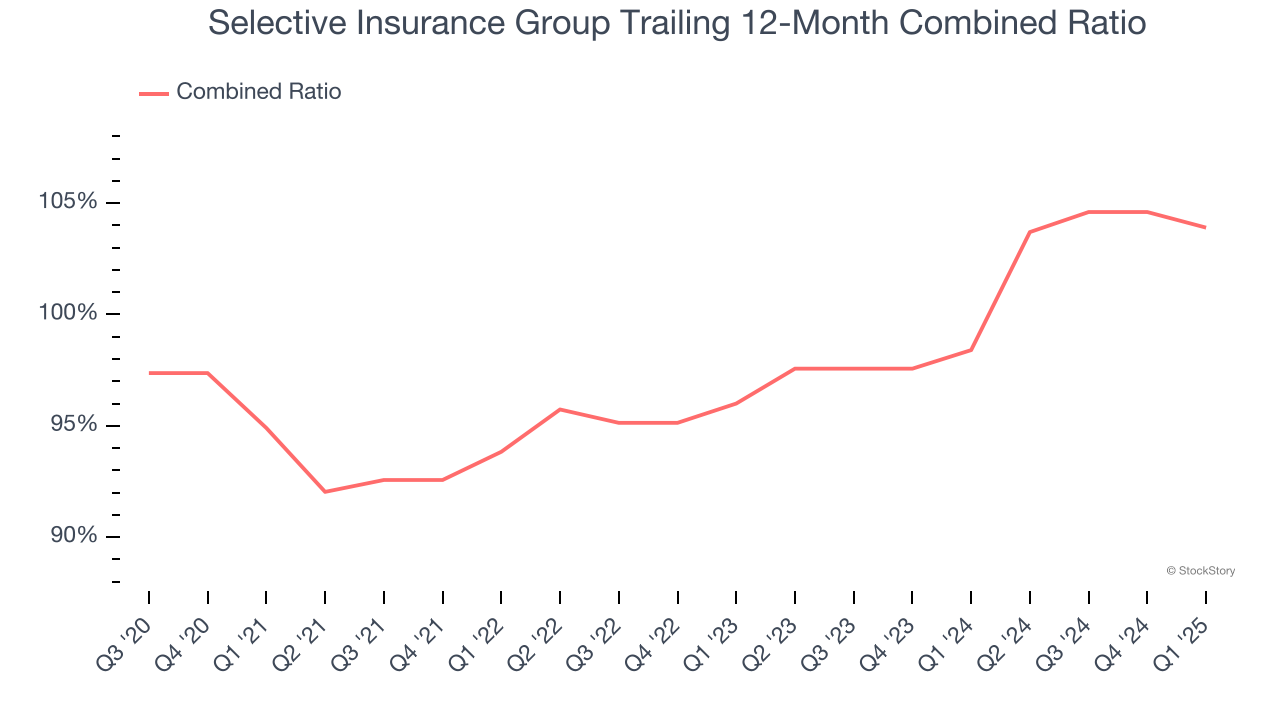
Revenue growth is one major determinant of business quality, and the efficiency of operations is another. For insurance companies, we look at the combined ratio rather than the operating expenses and margins that define sectors such as consumer, tech, and industrials.
The combined ratio sums the costs of underwriting (salaries, commissions, overhead) as well as what an insurer pays out in claims (losses) and divides it by net premiums earned. If a company boasts a combined ratio under 100%, it is underwriting profitably. If above 100%, it is losing money on its core operations of selling insurance policies.
Over the last four years, Selective Insurance Group’s combined ratio has swelled by 9 percentage points, hitting 104% for the past 12 months. Said differently, the company’s expenses have increased at a faster rate than revenue, which is usually raises questions in mature industries (the exception is a high-growth company that reinvests its profits in attractive ventures).
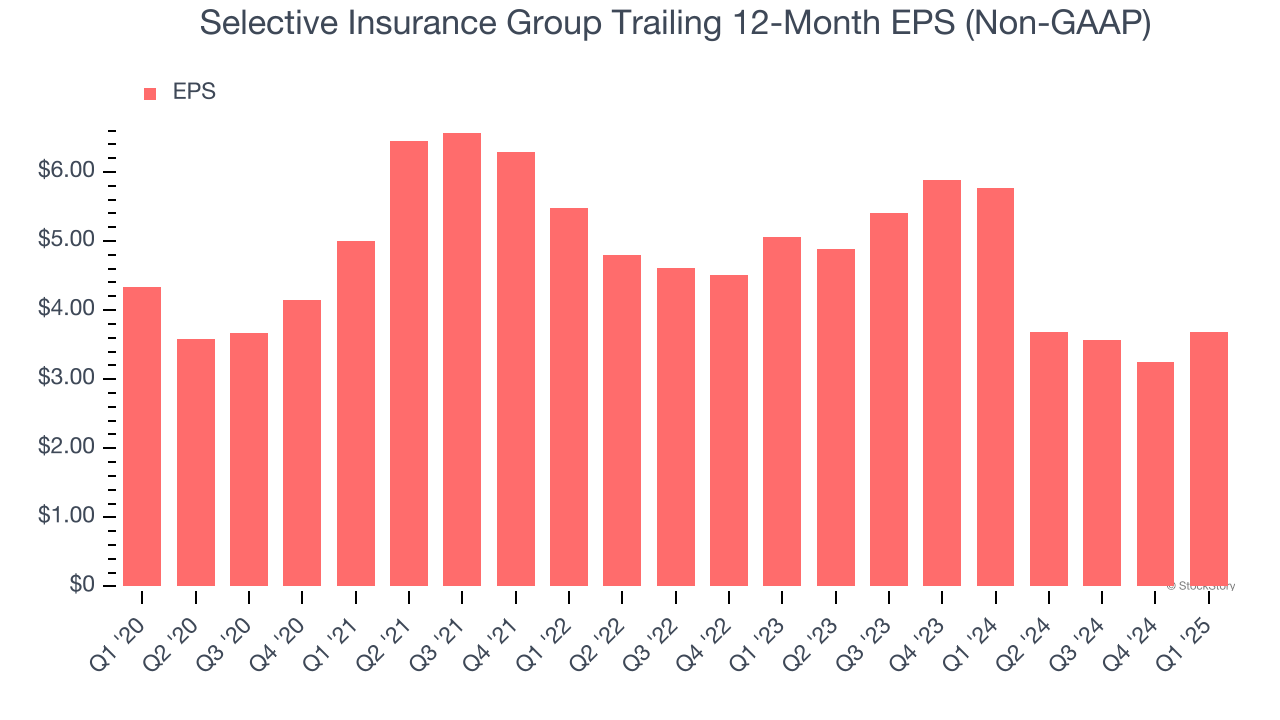
2. EPS Trending Down
We track the long-term change in earnings per share (EPS) because it highlights whether a company’s growth is profitable.
Sadly for Selective Insurance Group, its EPS declined by 3.2% annually over the last five years while its revenue grew by 12.1%. This tells us the company became less profitable on a per-share basis as it expanded.
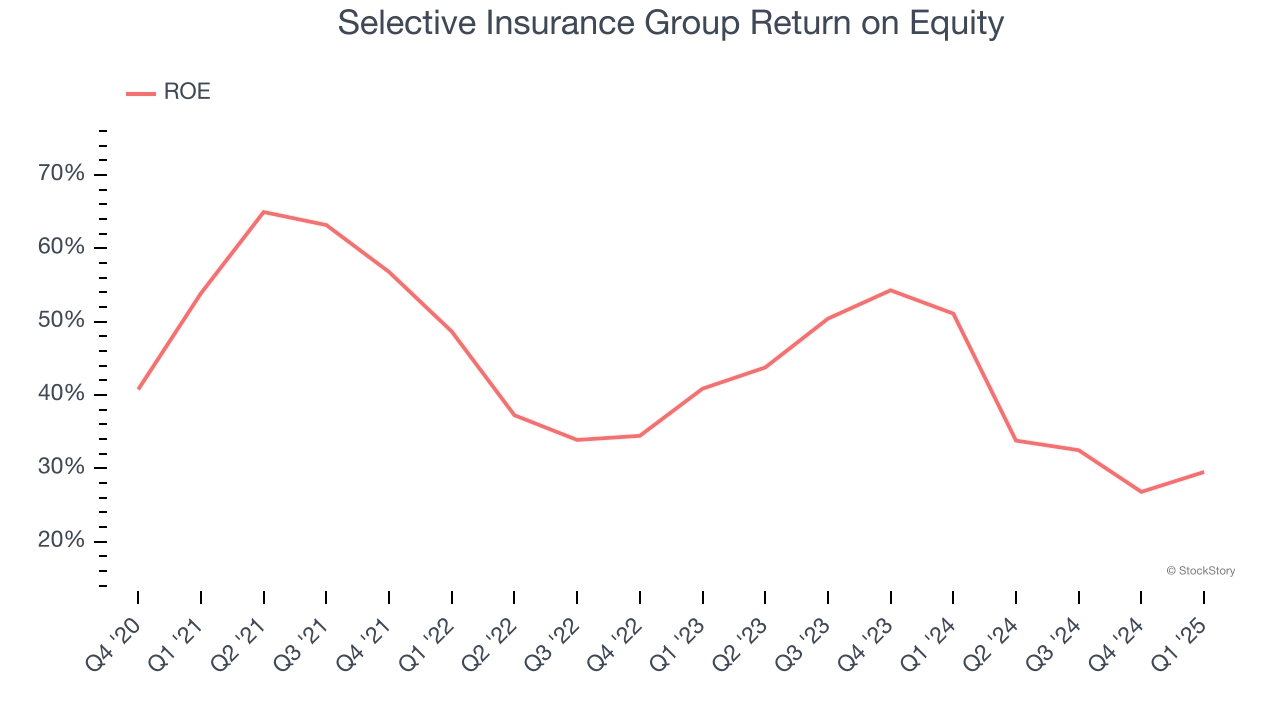
3. Previous Growth Initiatives Haven’t Impressed
Return on equity (ROE) serves as a comprehensive measure of an insurer's performance, showing how efficiently it converts shareholder capital into profits. Strong ROE performance typically translates to better returns for investors through a combination of earnings retention, share repurchases, and dividend distributions.
Over the last five years, Selective Insurance Group has averaged an ROE of 11.2%, uninspiring for a company operating in a sector where the average shakes out around 7.5%. This shows Selective Insurance Group has a weak competitive moat.
Final Judgment
Selective Insurance Group isn’t a terrible business, but it doesn’t pass our quality test. After the recent drawdown, the stock trades at 1.6× forward P/B (or $84.32 per share). Investors with a higher risk tolerance might like the company, but we don’t really see a big opportunity at the moment. We're fairly confident there are better investments elsewhere. Let us point you toward one of Charlie Munger’s all-time favorite businesses.
Stocks We Like More Than Selective Insurance Group
The market surged in 2024 and reached record highs after Donald Trump’s presidential victory in November, but questions about new economic policies are adding much uncertainty for 2025.
While the crowd speculates what might happen next, we’re homing in on the companies that can succeed regardless of the political or macroeconomic environment. Put yourself in the driver’s seat and build a durable portfolio by checking out our Top 9 Market-Beating Stocks. This is a curated list of our High Quality stocks that have generated a market-beating return of 183% over the last five years (as of March 31st 2025).
Stocks that made our list in 2020 include now familiar names such as Nvidia (+1,545% between March 2020 and March 2025) as well as under-the-radar businesses like the once-micro-cap company Kadant (+351% five-year return). Find your next big winner with StockStory today.