Intelligent lighting and space solutions provider Acuity Brands (NYSE: AYI) announced better-than-expected revenue in Q2 CY2025, with sales up 21.7% year on year to $1.18 billion. Its non-GAAP profit of $5.12 per share was 15.3% above analysts’ consensus estimates.
Is now the time to buy Acuity Brands? Find out by accessing our full research report, it’s free.
Acuity Brands (AYI) Q2 CY2025 Highlights:
- Revenue: $1.18 billion vs analyst estimates of $1.14 billion (21.7% year-on-year growth, 3.1% beat)
- Adjusted EPS: $5.12 vs analyst estimates of $4.44 (15.3% beat)
- Adjusted EBITDA: $236.3 million vs analyst estimates of $208.1 million (20% margin, 13.6% beat)
- Operating Margin: 11.9%, down from 15% in the same quarter last year
- Free Cash Flow Margin: 33.8%, up from 14.5% in the same quarter last year
- Organic Revenue rose 21.7% year on year (-3.2% in the same quarter last year)
- Market Capitalization: $8.80 billion
"We delivered strong performance in the third quarter of fiscal 2025," stated Neil Ashe, Chairman, President and Chief Executive Officer.
Company Overview
One of the pioneers of smart lights, Acuity (NYSE: AYI) designs and manufactures light fixtures and building management systems used in various industries.
Revenue Growth
A company’s long-term sales performance can indicate its overall quality. Any business can experience short-term success, but top-performing ones enjoy sustained growth for years. Over the last five years, Acuity Brands grew its sales at a sluggish 4.3% compounded annual growth rate. This was below our standard for the industrials sector and is a tough starting point for our analysis.
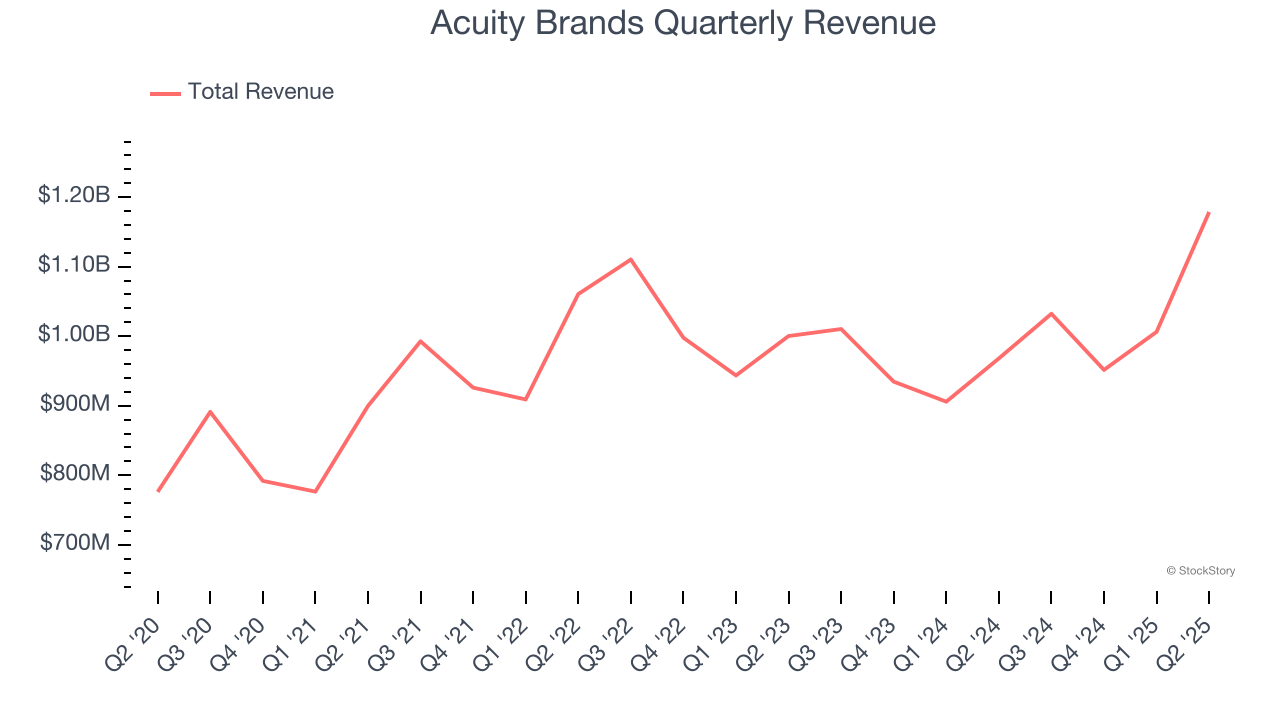
Long-term growth is the most important, but within industrials, a half-decade historical view may miss new industry trends or demand cycles. Acuity Brands’s recent performance shows its demand has slowed as its annualized revenue growth of 1.4% over the last two years was below its five-year trend. 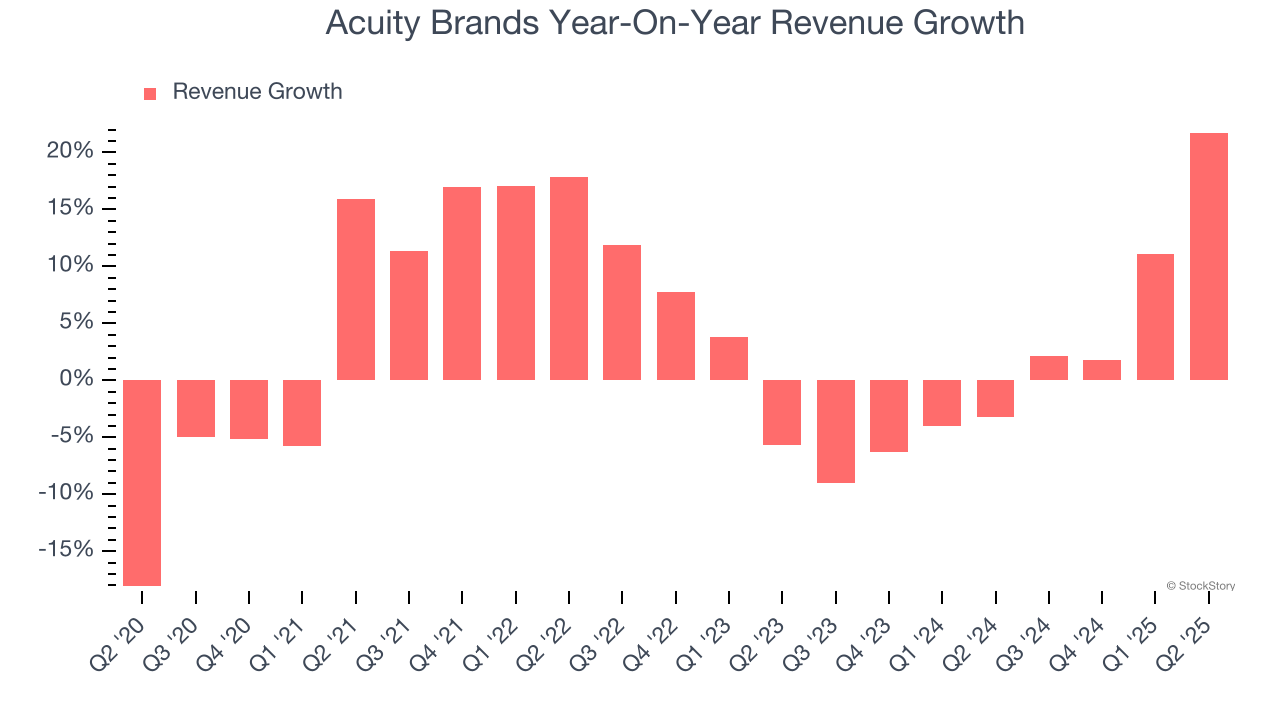
Acuity Brands also reports organic revenue, which strips out one-time events like acquisitions and currency fluctuations that don’t accurately reflect its fundamentals. Over the last two years, Acuity Brands’s organic revenue was flat. Because this number aligns with its normal revenue growth, we can see the company’s core operations (not acquisitions and divestitures) drove most of its results. 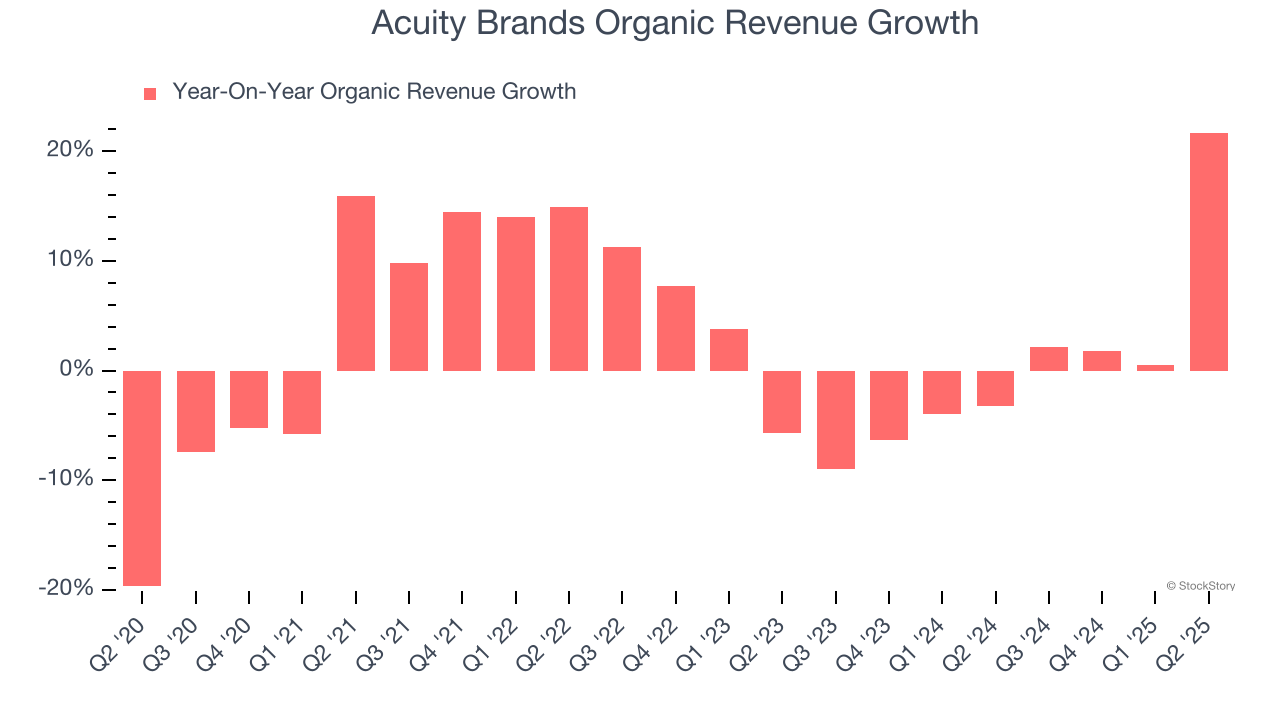
This quarter, Acuity Brands reported robust year-on-year revenue growth of 21.7%, and its $1.18 billion of revenue topped Wall Street estimates by 3.1%.
Looking ahead, sell-side analysts expect revenue to grow 12% over the next 12 months, an improvement versus the last two years. This projection is commendable and indicates its newer products and services will fuel better top-line performance.
Here at StockStory, we certainly understand the potential of thematic investing. Diverse winners from Microsoft (MSFT) to Alphabet (GOOG), Coca-Cola (KO) to Monster Beverage (MNST) could all have been identified as promising growth stories with a megatrend driving the growth. So, in that spirit, we’ve identified a relatively under-the-radar profitable growth stock benefiting from the rise of AI, available to you FREE via this link.
Operating Margin
Operating margin is an important measure of profitability as it shows the portion of revenue left after accounting for all core expenses – everything from the cost of goods sold to advertising and wages. It’s also useful for comparing profitability across companies with different levels of debt and tax rates because it excludes interest and taxes.
Acuity Brands has been an efficient company over the last five years. It was one of the more profitable businesses in the industrials sector, boasting an average operating margin of 12.7%. This result isn’t surprising as its high gross margin gives it a favorable starting point.
Looking at the trend in its profitability, Acuity Brands’s operating margin rose by 1 percentage points over the last five years, as its sales growth gave it operating leverage.
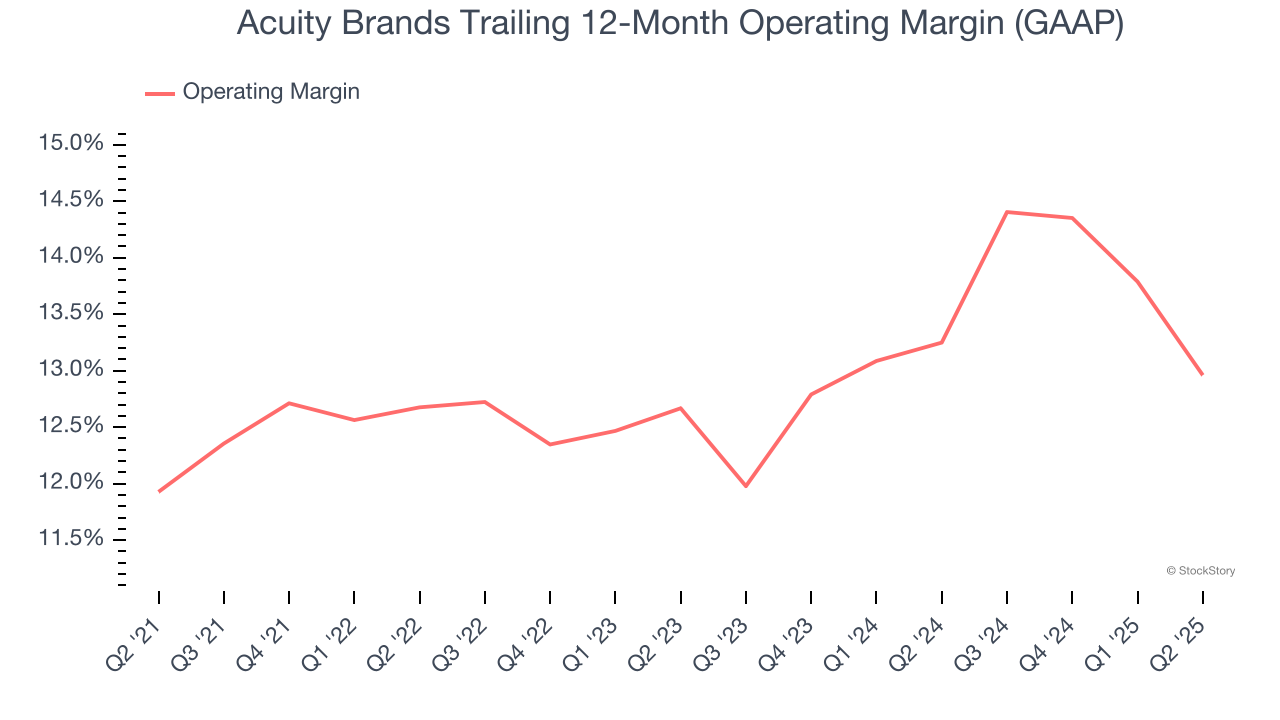
This quarter, Acuity Brands generated an operating margin profit margin of 11.9%, down 3.1 percentage points year on year. Conversely, its revenue and gross margin actually rose, so we can assume it was less efficient because its operating expenses like marketing, R&D, and administrative overhead grew faster than its revenue.
Earnings Per Share
We track the long-term change in earnings per share (EPS) for the same reason as long-term revenue growth. Compared to revenue, however, EPS highlights whether a company’s growth is profitable.
Acuity Brands’s EPS grew at a remarkable 14.6% compounded annual growth rate over the last five years, higher than its 4.3% annualized revenue growth. This tells us the company became more profitable on a per-share basis as it expanded.
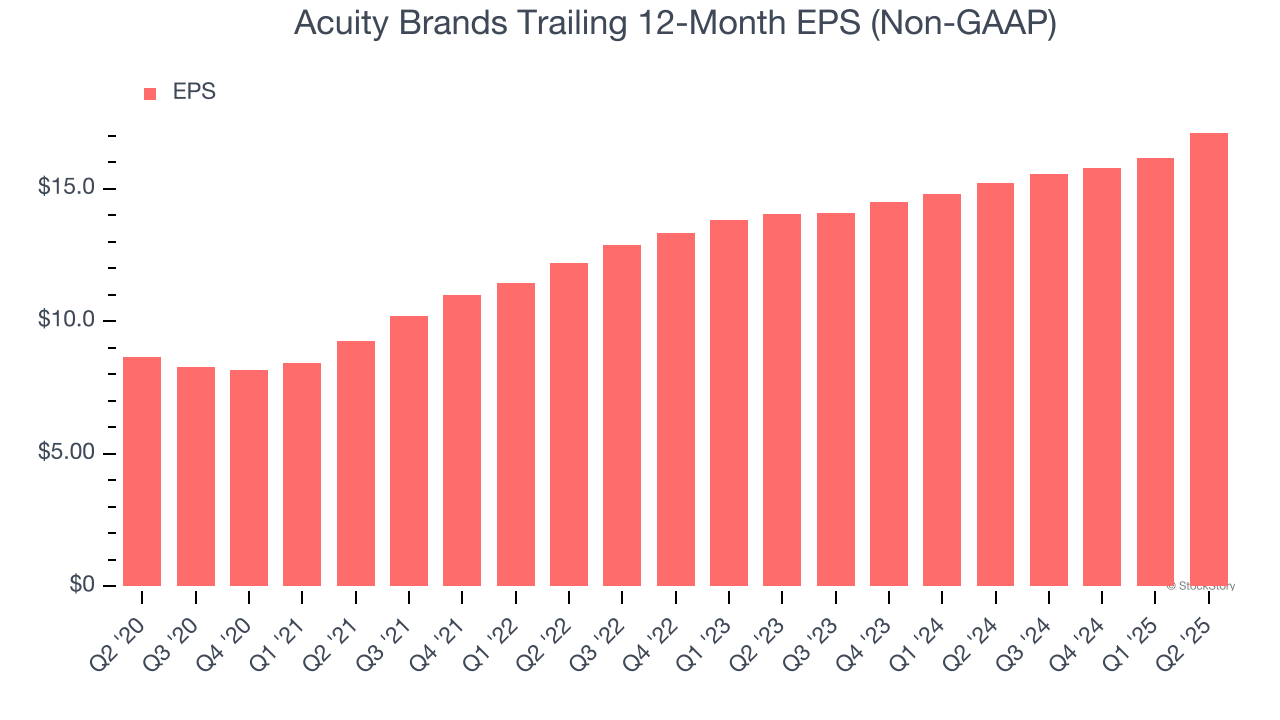
Diving into the nuances of Acuity Brands’s earnings can give us a better understanding of its performance. As we mentioned earlier, Acuity Brands’s operating margin declined this quarter but expanded by 1 percentage points over the last five years. Its share count also shrank by 20.5%, and these factors together are positive signs for shareholders because improving profitability and share buybacks turbocharge EPS growth relative to revenue growth. 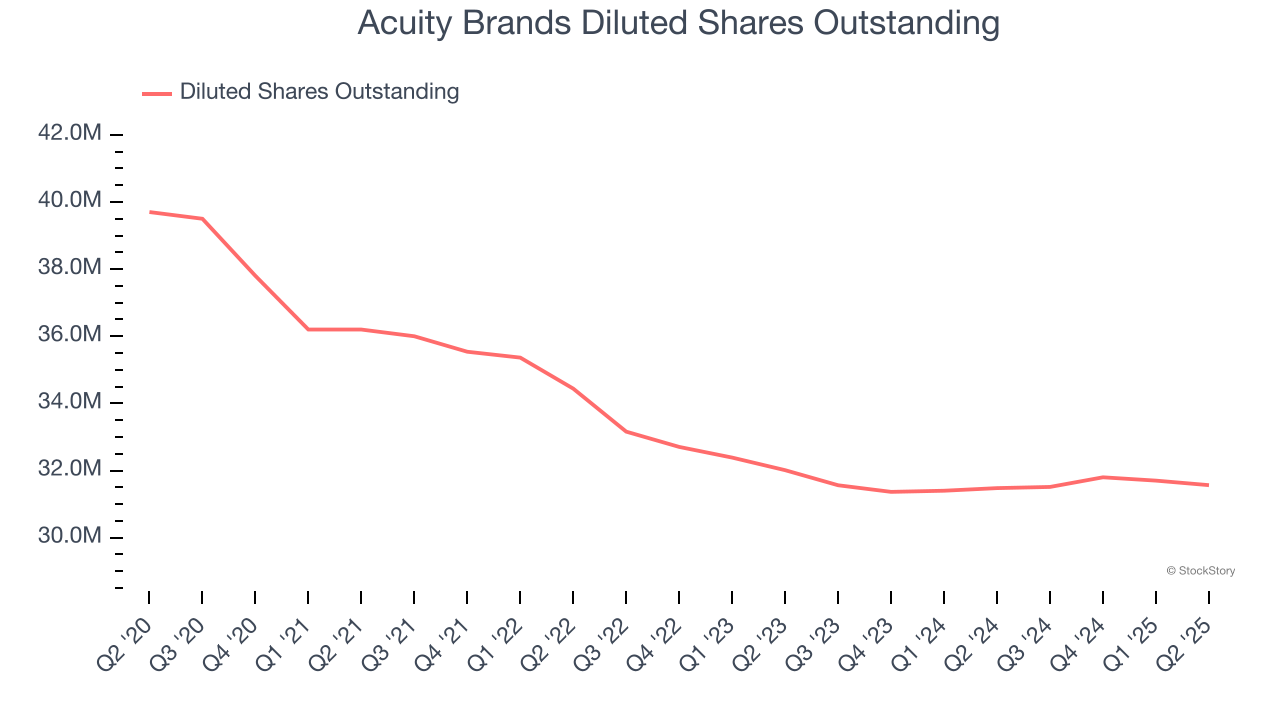
Like with revenue, we analyze EPS over a shorter period to see if we are missing a change in the business.
For Acuity Brands, its two-year annual EPS growth of 10.4% was lower than its five-year trend. We still think its growth was good and hope it can accelerate in the future.
In Q2, Acuity Brands reported EPS at $5.12, up from $4.15 in the same quarter last year. This print easily cleared analysts’ estimates, and shareholders should be content with the results. Over the next 12 months, Wall Street expects Acuity Brands’s full-year EPS of $17.12 to grow 8.7%.
Key Takeaways from Acuity Brands’s Q2 Results
We were impressed by how significantly Acuity Brands blew past analysts’ organic revenue expectations this quarter. We were also excited its EPS and EBITDA outperformed Wall Street’s estimates by a wide margin. Zooming out, we think this quarter featured some important positives. The stock traded up 7.5% to $308.70 immediately following the results.
Acuity Brands had an encouraging quarter, but one earnings result doesn’t necessarily make the stock a buy. Let’s see if this is a good investment. The latest quarter does matter, but not nearly as much as longer-term fundamentals and valuation, when deciding if the stock is a buy. We cover that in our actionable full research report which you can read here, it’s free.