APi currently trades at $50.69 and has been a dream stock for shareholders. It’s returned 315% since June 2020, more than tripling the S&P 500’s 102% gain. The company has also beaten the index over the past six months as its stock price is up 38.8% thanks to its solid quarterly results.
Is now the time to buy APi, or should you be careful about including it in your portfolio? Check out our in-depth research report to see what our analysts have to say, it’s free.
Why Is APi Not Exciting?
Despite the momentum, we're swiping left on APi for now. Here are three reasons why there are better opportunities than APG and a stock we'd rather own.
1. Slow Organic Growth Suggests Waning Demand In Core Business
We can better understand Construction and Maintenance Services companies by analyzing their organic revenue. This metric gives visibility into APi’s core business because it excludes one-time events such as mergers, acquisitions, and divestitures along with foreign currency fluctuations - non-fundamental factors that can manipulate the income statement.
Over the last two years, APi’s organic revenue averaged 1.1% year-on-year growth. This performance was underwhelming and suggests it may need to improve its products, pricing, or go-to-market strategy, which can add an extra layer of complexity to its operations. 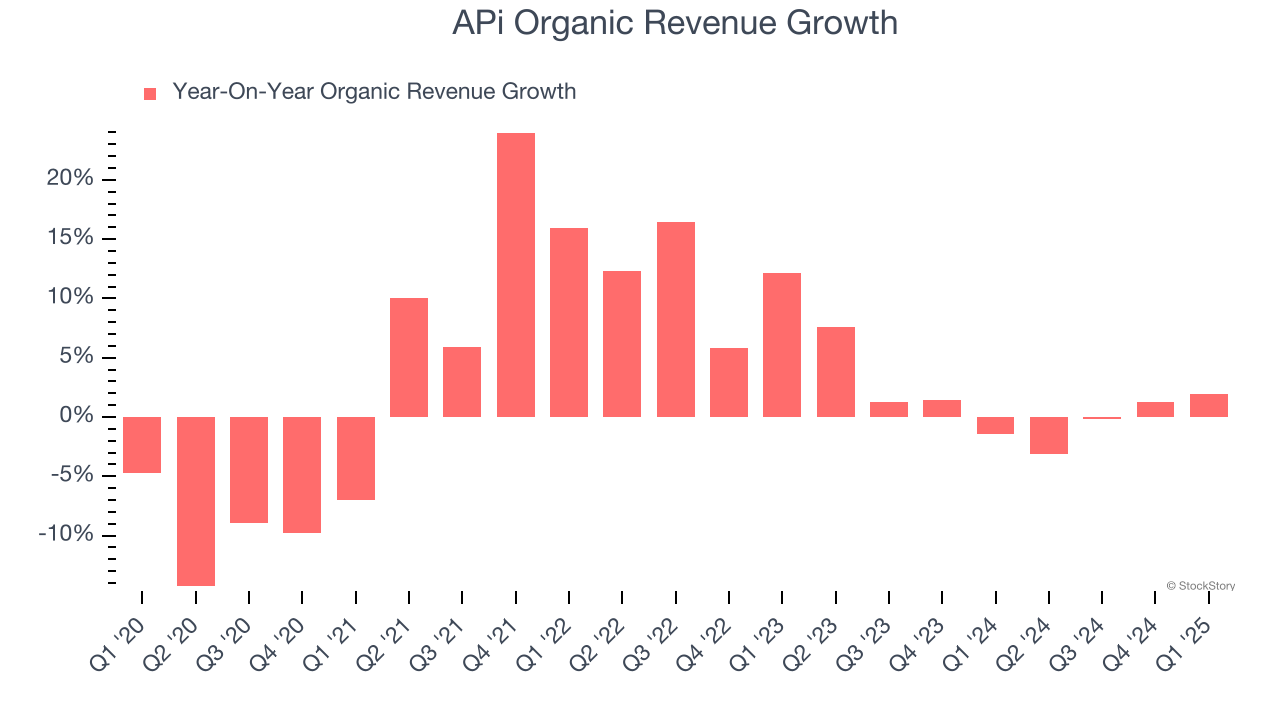
2. Free Cash Flow Margin Dropping
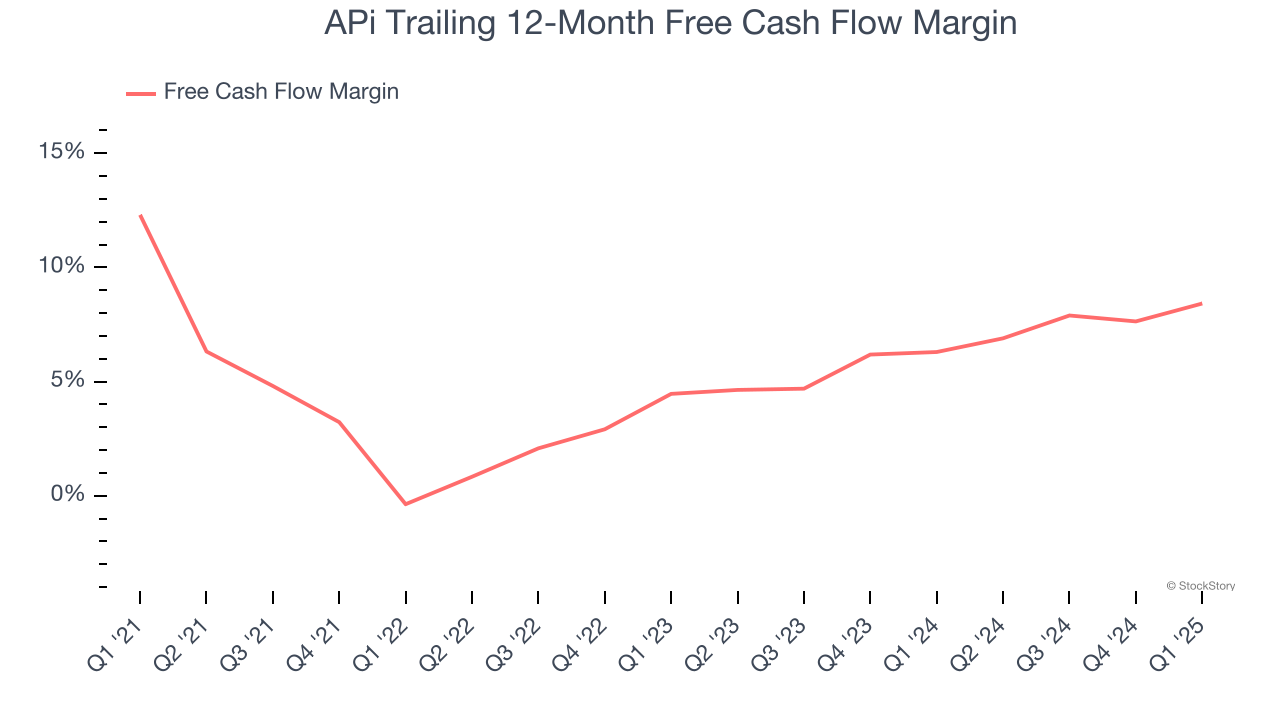
If you’ve followed StockStory for a while, you know we emphasize free cash flow. Why, you ask? We believe that in the end, cash is king, and you can’t use accounting profits to pay the bills.
As you can see below, APi’s margin dropped by 3.9 percentage points over the last five years. It may have ticked higher more recently, but shareholders are likely hoping for its margin to at least revert to its historical level. If the longer-term trend returns, it could signal increasing investment needs and capital intensity. APi’s free cash flow margin for the trailing 12 months was 8.4%.
3. Previous Growth Initiatives Haven’t Impressed
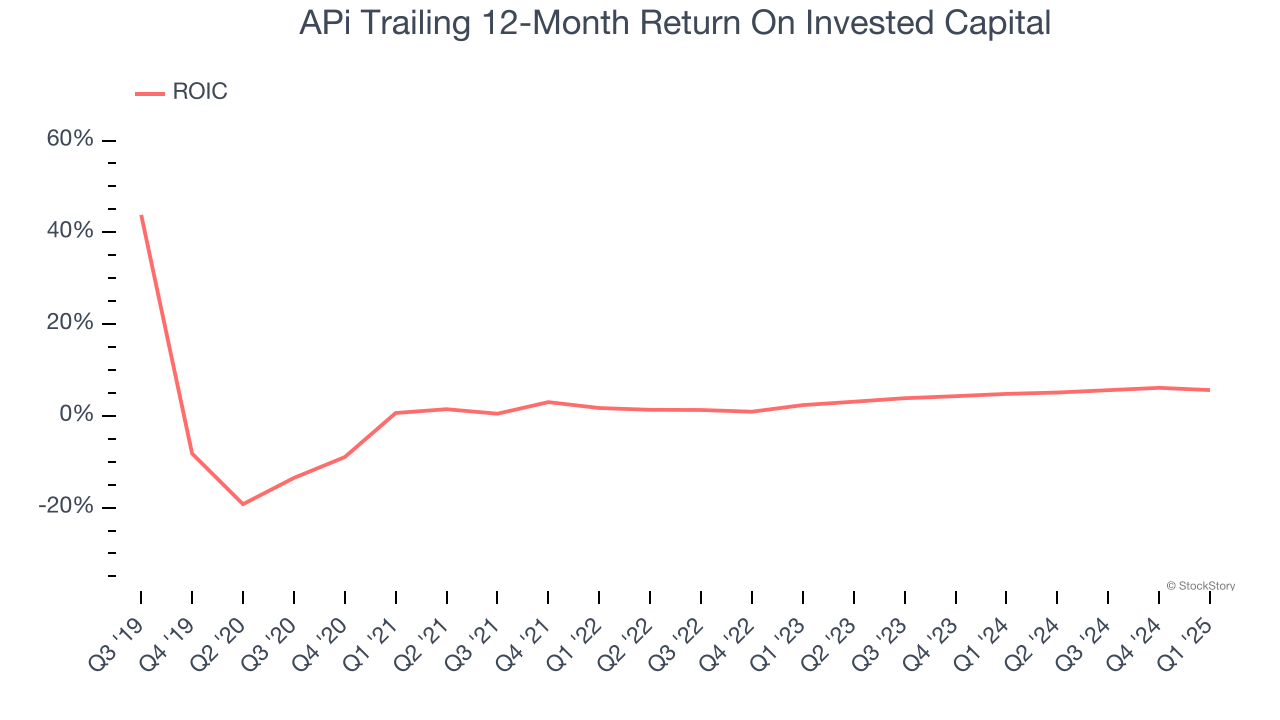
Growth gives us insight into a company’s long-term potential, but how capital-efficient was that growth? A company’s ROIC explains this by showing how much operating profit it makes compared to the money it has raised (debt and equity).
APi historically did a mediocre job investing in profitable growth initiatives. Its five-year average ROIC was 3%, lower than the typical cost of capital (how much it costs to raise money) for industrials companies.
Final Judgment
APi’s business quality ultimately falls short of our standards. With its shares topping the market in recent months, the stock trades at 23.8× forward P/E (or $50.69 per share). At this valuation, there’s a lot of good news priced in - we think other companies feature superior fundamentals at the moment. We’d suggest looking at a top digital advertising platform riding the creator economy.
High-Quality Stocks for All Market Conditions
Donald Trump’s victory in the 2024 U.S. Presidential Election sent major indices to all-time highs, but stocks have retraced as investors debate the health of the economy and the potential impact of tariffs.
While this leaves much uncertainty around 2025, a few companies are poised for long-term gains regardless of the political or macroeconomic climate, like our Top 5 Growth Stocks for this month. This is a curated list of our High Quality stocks that have generated a market-beating return of 183% over the last five years (as of March 31st 2025).
Stocks that made our list in 2020 include now familiar names such as Nvidia (+1,545% between March 2020 and March 2025) as well as under-the-radar businesses like the once-micro-cap company Tecnoglass (+1,754% five-year return). Find your next big winner with StockStory today.