CECO Environmental has been treading water for the past six months, recording a small return of 4% while holding steady at $30.66.
Is now the time to buy CECO? Or does the price properly account for its business quality and fundamentals? Find out in our full research report, it’s free.
Why Does CECO Environmental Spark Debate?
With roots dating back to 1869 and a focus on creating cleaner industrial operations, CECO Environmental (NASDAQ: CECO) provides technology and expertise that helps industrial companies reduce emissions, treat water, and improve energy efficiency across various sectors.
Two Positive Attributes:
1. Skyrocketing Revenue Shows Strong Momentum
Reviewing a company’s long-term sales performance reveals insights into its quality. Even a bad business can shine for one or two quarters, but a top-tier one grows for years. Luckily, CECO Environmental’s sales grew at an excellent 12.6% compounded annual growth rate over the last five years. Its growth surpassed the average business services company and shows its offerings resonate with customers. 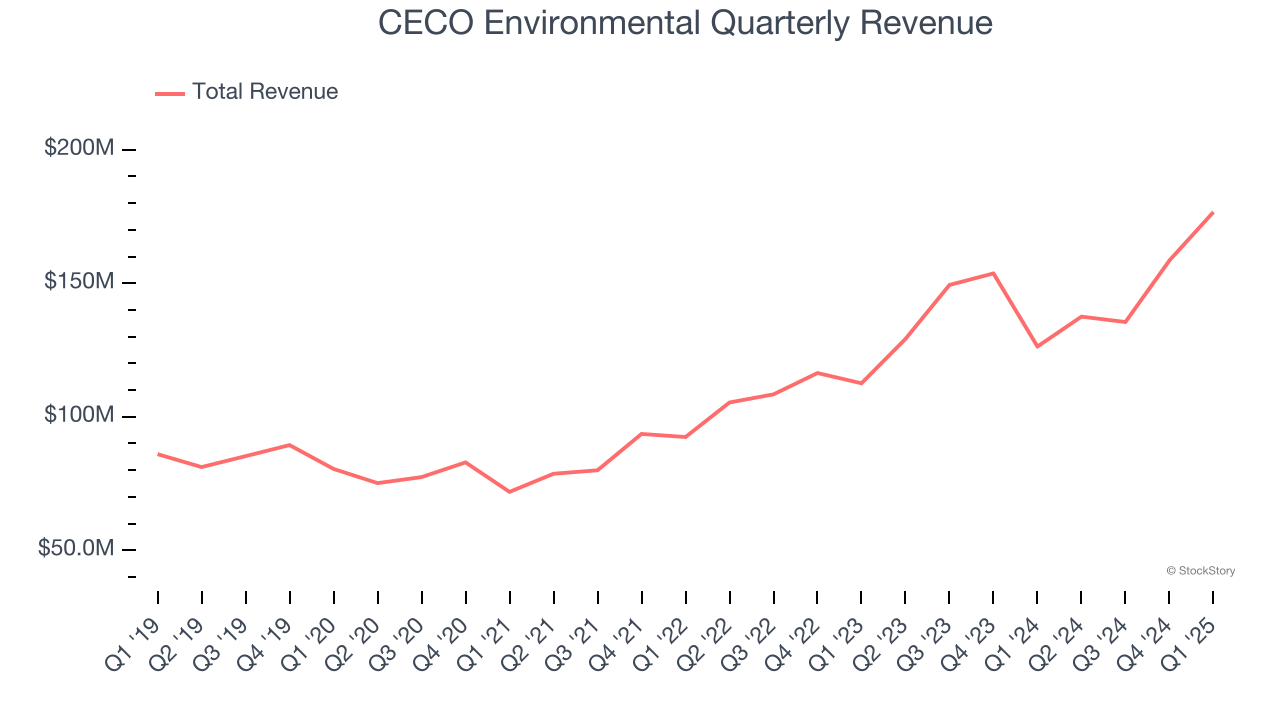
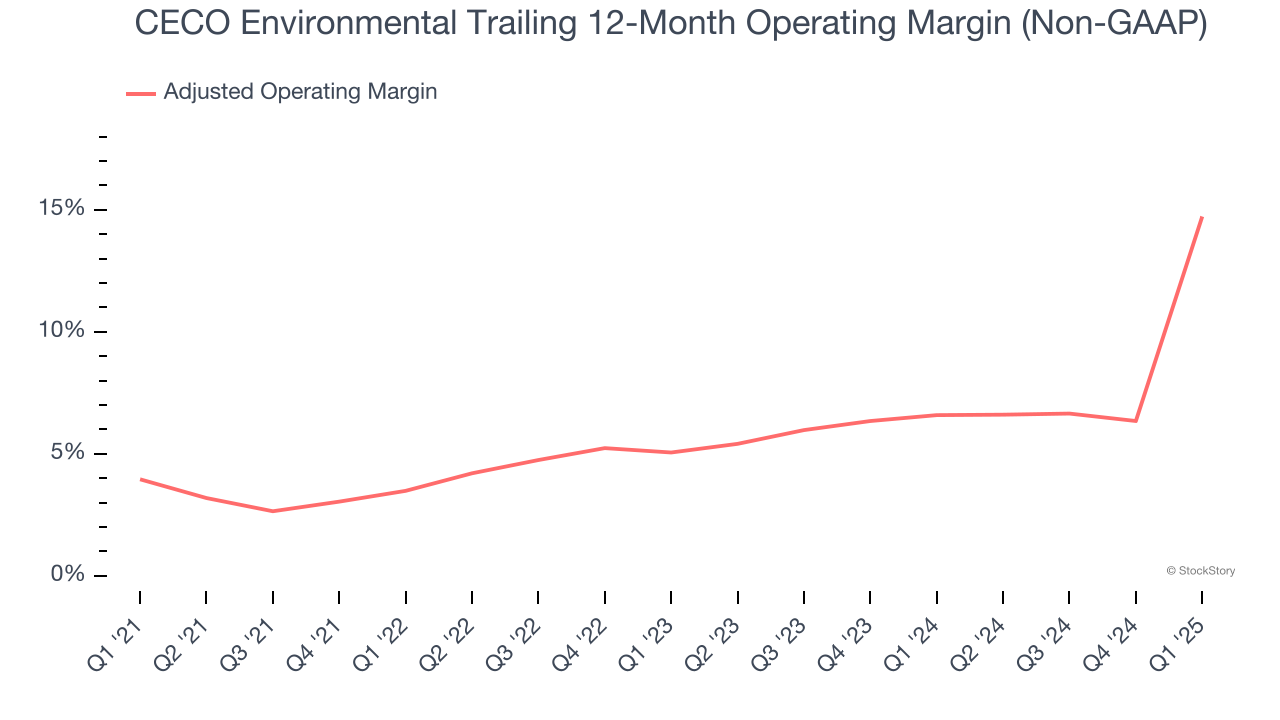
2. Adjusted Operating Margin Rising, Profits Up
Adjusted operating margin is an important measure of profitability as it shows the portion of revenue left after accounting for all core expenses – everything from the cost of goods sold to advertising and wages. It’s also useful for comparing profitability across companies because it excludes non-recurring expenses, interest on debt, and taxes.
CECO Environmental’s adjusted operating margin rose by 10.8 percentage points over the last five years, as its sales growth gave it immense operating leverage. Its adjusted operating margin for the trailing 12 months was 14.7%.
One Reason to be Careful:
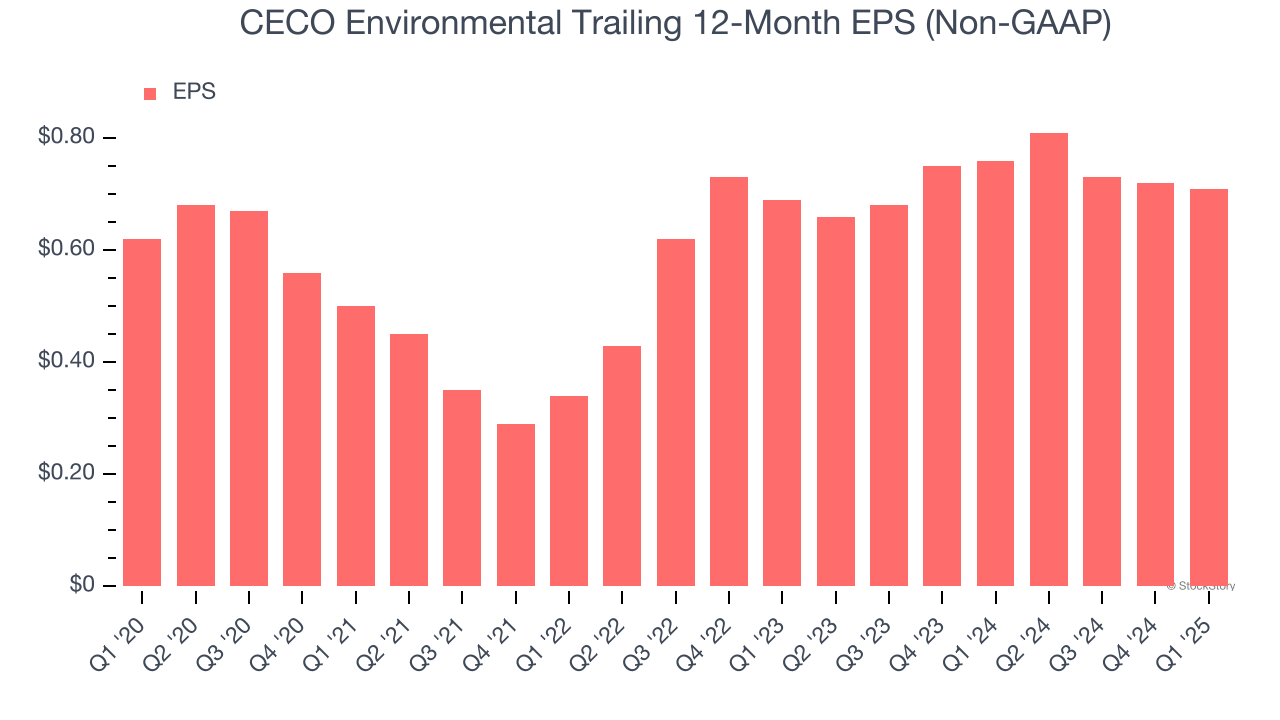
EPS Barely Growing
We track the long-term change in earnings per share (EPS) because it highlights whether a company’s growth is profitable.
CECO Environmental’s EPS grew at a weak 2.7% compounded annual growth rate over the last five years, lower than its 12.6% annualized revenue growth. This tells us the company became less profitable on a per-share basis as it expanded.
Final Judgment
CECO Environmental’s positive characteristics outweigh the negatives, but at $30.66 per share (or 23.3× forward P/E), is now the time to initiate a position? See for yourself in our in-depth research report, it’s free.
Stocks We Like Even More Than CECO Environmental
Donald Trump’s victory in the 2024 U.S. Presidential Election sent major indices to all-time highs, but stocks have retraced as investors debate the health of the economy and the potential impact of tariffs.
While this leaves much uncertainty around 2025, a few companies are poised for long-term gains regardless of the political or macroeconomic climate, like our Top 9 Market-Beating Stocks. This is a curated list of our High Quality stocks that have generated a market-beating return of 183% over the last five years (as of March 31st 2025).
Stocks that made our list in 2020 include now familiar names such as Nvidia (+1,545% between March 2020 and March 2025) as well as under-the-radar businesses like the once-micro-cap company Kadant (+351% five-year return). Find your next big winner with StockStory today.