
Shareholders of ChargePoint would probably like to forget the past six months even happened. The stock dropped 34.3% and now trades at $0.75. This was partly due to its softer quarterly results and may have investors wondering how to approach the situation.
Is now the time to buy ChargePoint, or should you be careful about including it in your portfolio? Dive into our full research report to see our analyst team’s opinion, it’s free.
Why Is ChargePoint Not Exciting?
Even though the stock has become cheaper, we don't have much confidence in ChargePoint. Here are three reasons why you should be careful with CHPT and a stock we'd rather own.
1. Revenue Tumbling Downwards
Long-term growth is the most important, but within industrials, a stretched historical view may miss new industry trends or demand cycles. ChargePoint’s recent performance marks a sharp pivot from its five-year trend as its revenue has shown annualized declines of 11.2% over the last two years. ChargePoint isn’t alone in its struggles as the Renewable Energy industry experienced a cyclical downturn, with many similar businesses observing lower sales at this time. 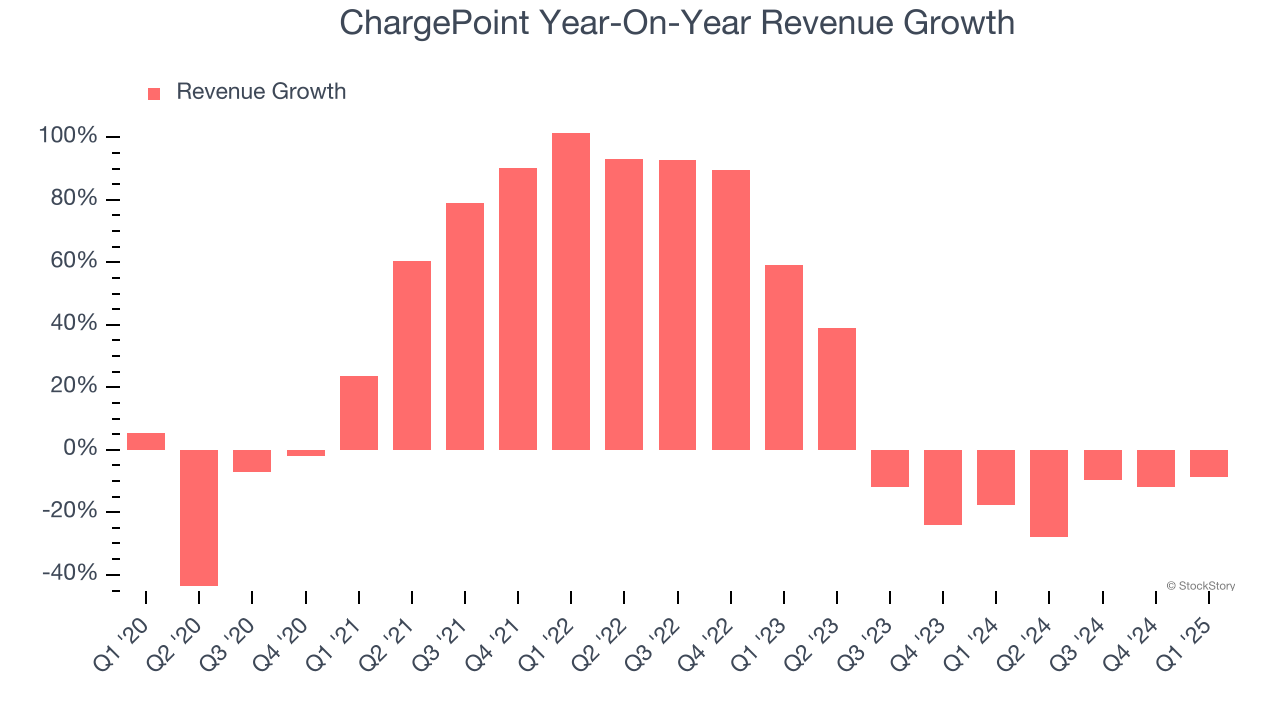
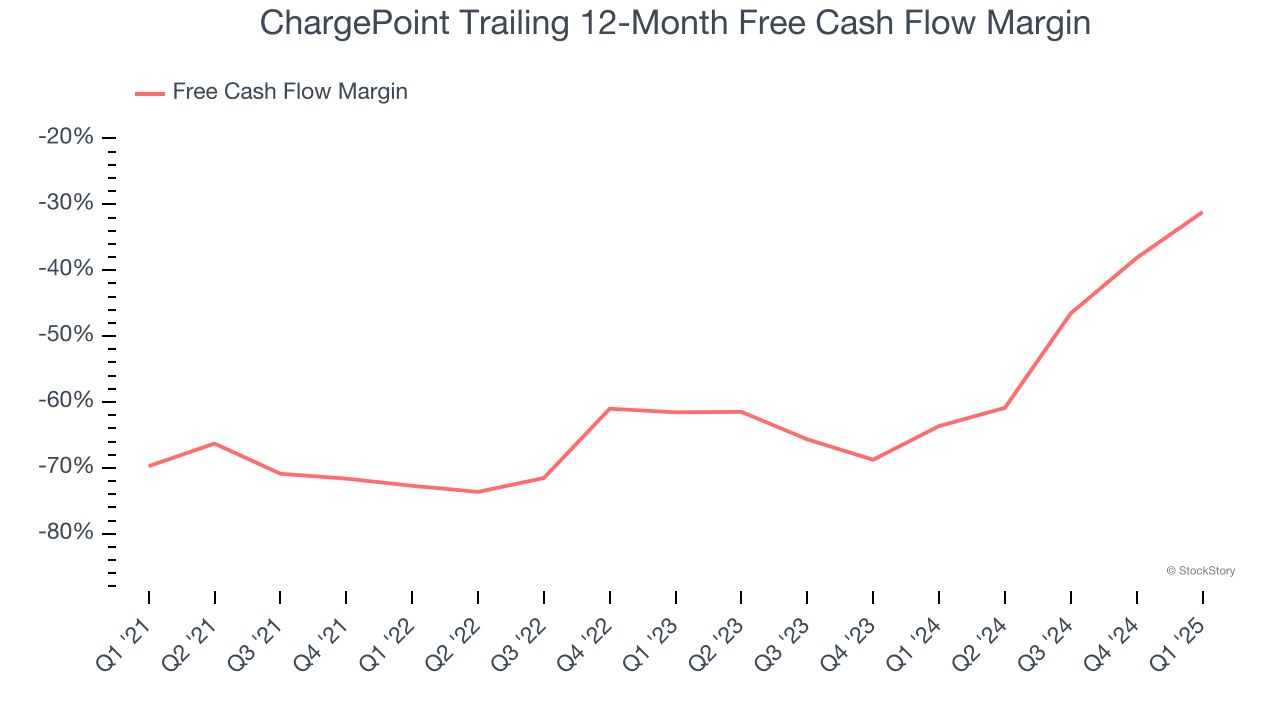
2. Cash Burn Ignites Concerns
Free cash flow isn't a prominently featured metric in company financials and earnings releases, but we think it's telling because it accounts for all operating and capital expenses, making it tough to manipulate. Cash is king.
ChargePoint’s demanding reinvestments have drained its resources over the last five years, putting it in a pinch and limiting its ability to return capital to investors. Its free cash flow margin averaged negative 57.8%, meaning it lit $57.79 of cash on fire for every $100 in revenue.
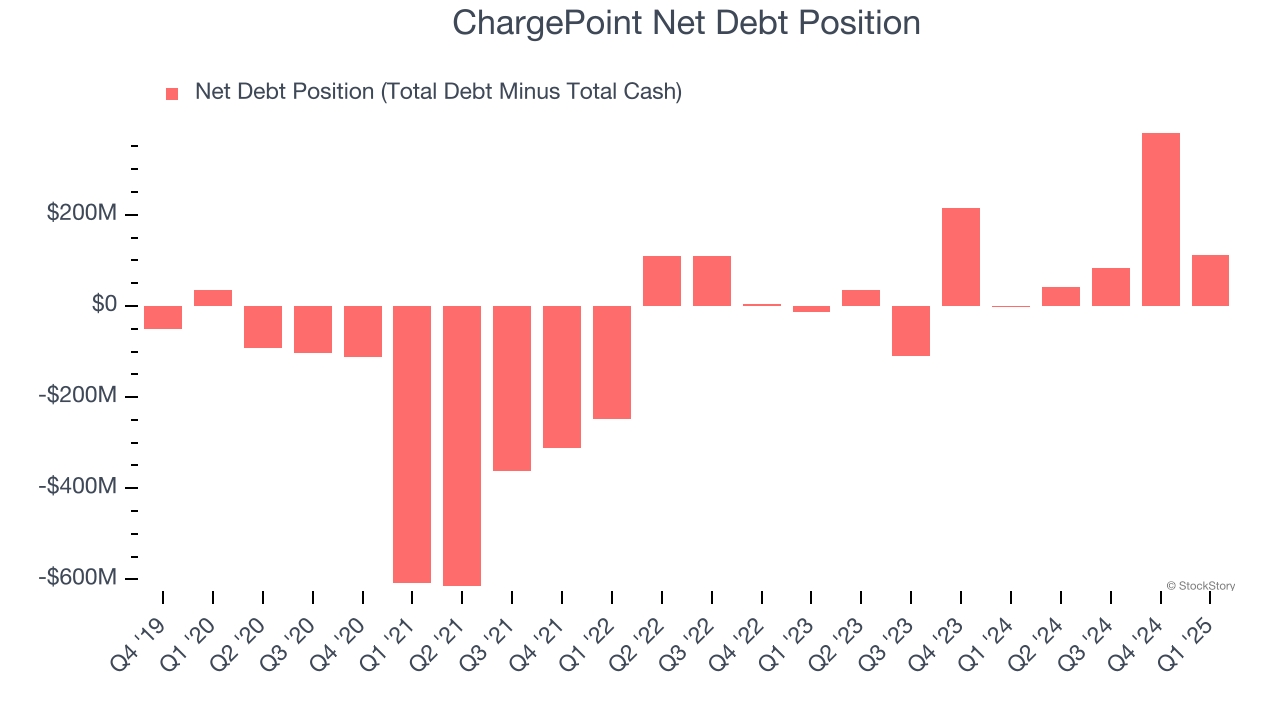
3. Short Cash Runway Exposes Shareholders to Potential Dilution
As long-term investors, the risk we care about most is the permanent loss of capital, which can happen when a company goes bankrupt or raises money from a disadvantaged position. This is separate from short-term stock price volatility, something we are much less bothered by.
ChargePoint burned through $127 million of cash over the last year, and its $307.8 million of debt exceeds the $196.3 million of cash on its balance sheet. This is a deal breaker for us because indebted loss-making companies spell trouble.
Unless the ChargePoint’s fundamentals change quickly, it might find itself in a position where it must raise capital from investors to continue operating. Whether that would be favorable is unclear because dilution is a headwind for shareholder returns.
We remain cautious of ChargePoint until it generates consistent free cash flow or any of its announced financing plans materialize on its balance sheet.
Final Judgment
ChargePoint isn’t a terrible business, but it doesn’t pass our quality test. Following the recent decline, the stock trades at $0.75 per share (or a forward price-to-sales ratio of 0.8×). The market typically values companies like ChargePoint based on their anticipated profits for the next 12 months, but it expects the business to lose money. We also think the upside isn’t great compared to the potential downside here - there are more exciting stocks to buy. We’d recommend looking at a fast-growing restaurant franchise with an A+ ranch dressing sauce.
High-Quality Stocks for All Market Conditions
Donald Trump’s victory in the 2024 U.S. Presidential Election sent major indices to all-time highs, but stocks have retraced as investors debate the health of the economy and the potential impact of tariffs.
While this leaves much uncertainty around 2025, a few companies are poised for long-term gains regardless of the political or macroeconomic climate, like our Top 9 Market-Beating Stocks. This is a curated list of our High Quality stocks that have generated a market-beating return of 183% over the last five years (as of March 31st 2025).
Stocks that made our list in 2020 include now familiar names such as Nvidia (+1,545% between March 2020 and March 2025) as well as under-the-radar businesses like the once-micro-cap company Tecnoglass (+1,754% five-year return). Find your next big winner with StockStory today.


