Amplitude has had an impressive run over the past six months as its shares have beaten the S&P 500 by 7.5%. The stock now trades at $11.80, marking a 10.4% gain. This was partly thanks to its solid quarterly results, and the run-up might have investors contemplating their next move.
Is there a buying opportunity in Amplitude, or does it present a risk to your portfolio? Get the full stock story straight from our expert analysts, it’s free.
Why Is Amplitude Not Exciting?
We’re happy investors have made money, but we don't have much confidence in Amplitude. Here are three reasons why we avoid AMPL and a stock we'd rather own.
1. Weak Billings Point to Soft Demand
Billings is a non-GAAP metric that is often called “cash revenue” because it shows how much money the company has collected from customers in a certain period. This is different from revenue, which must be recognized in pieces over the length of a contract.
Amplitude’s billings came in at $87.29 million in Q1, and over the last four quarters, its year-on-year growth averaged 8.7%. This performance was underwhelming and suggests that increasing competition is causing challenges in acquiring/retaining customers. 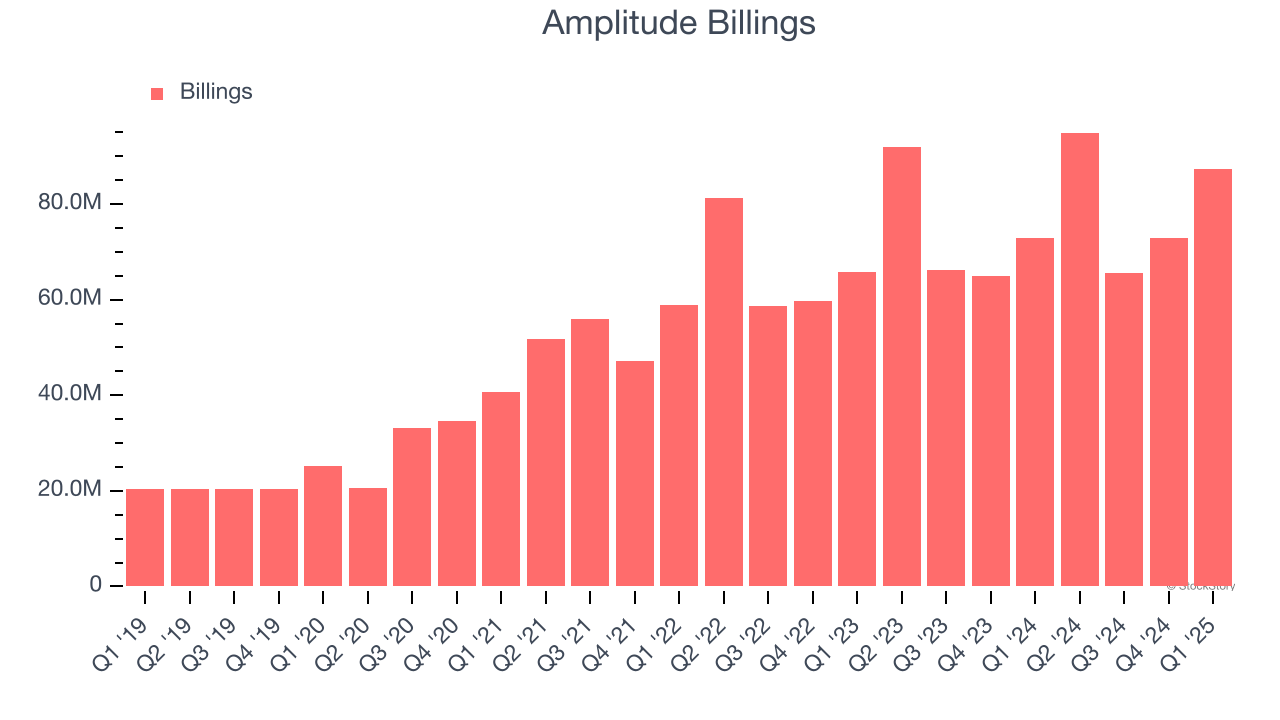
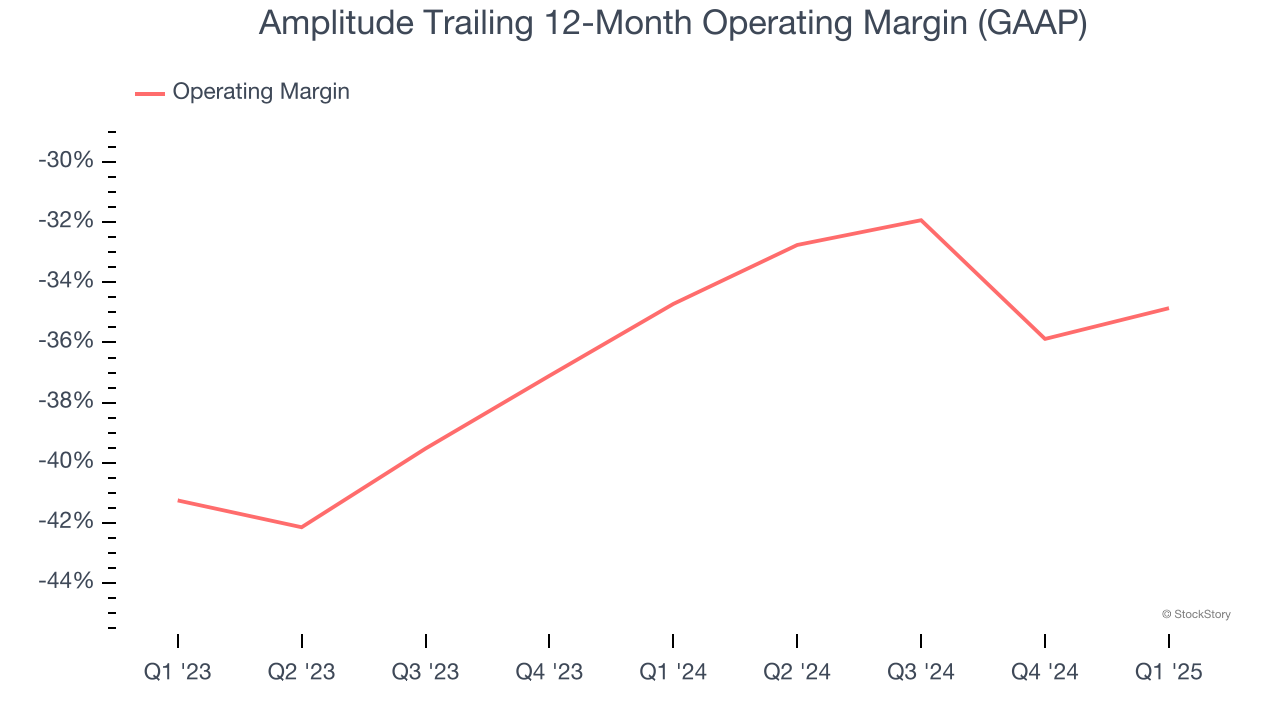
2. Operating Losses Sound the Alarms
While many software businesses point investors to their adjusted profits, which exclude stock-based compensation (SBC), we prefer GAAP operating margin because SBC is a legitimate expense used to attract and retain talent. This is one of the best measures of profitability because it shows how much money a company takes home after developing, marketing, and selling its products.
Amplitude’s operating margin might fluctuated slightly over the last 12 months but has remained more or less the same, averaging negative 34.9% over the last year. Unprofitable software companies that fail to improve their losses or grow sales rapidly deserve extra scrutiny. For the time being, it’s unclear if Amplitude’s business model is sustainable.
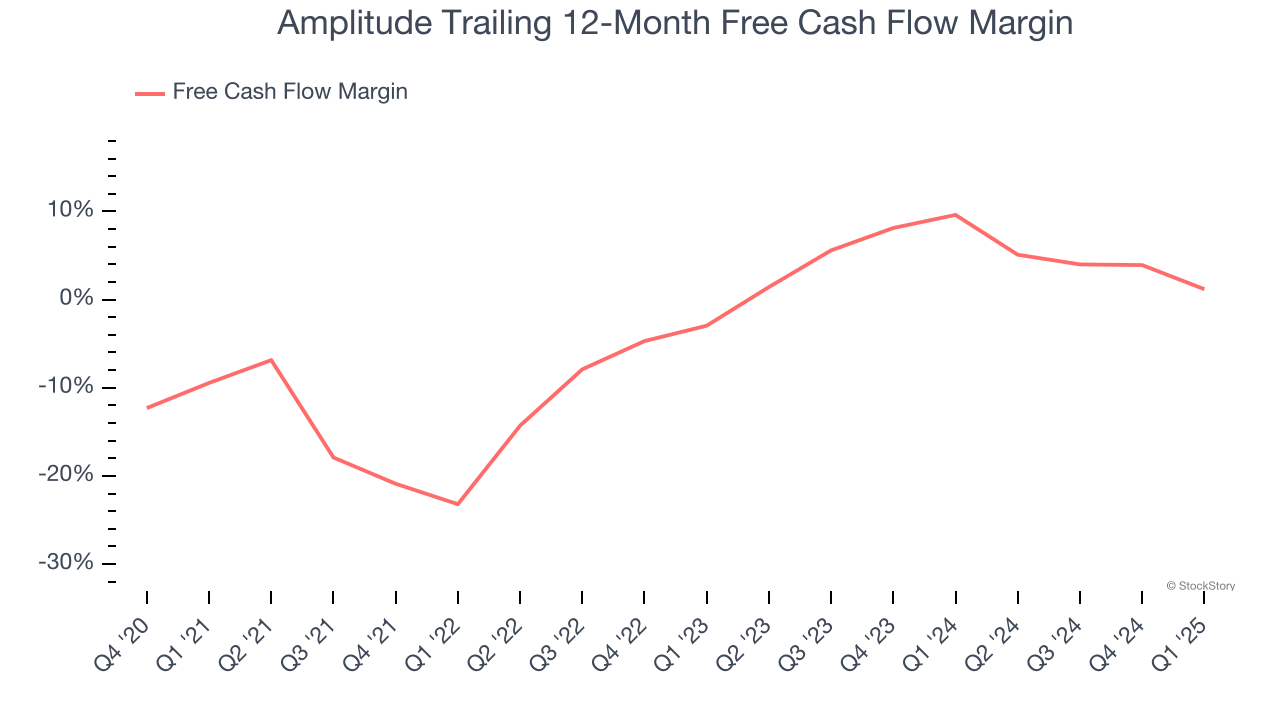
3. Mediocre Free Cash Flow Margin Limits Reinvestment Potential
Free cash flow isn't a prominently featured metric in company financials and earnings releases, but we think it's telling because it accounts for all operating and capital expenses, making it tough to manipulate. Cash is king.
Amplitude has shown weak cash profitability over the last year, giving the company limited opportunities to return capital to shareholders. Its free cash flow margin averaged 1.2%, subpar for a software business.
Final Judgment
Amplitude isn’t a terrible business, but it doesn’t pass our quality test. With its shares outperforming the market lately, the stock trades at 4.7× forward price-to-sales (or $11.80 per share). Beauty is in the eye of the beholder, but our analysis shows the upside isn’t great compared to the potential downside. We're fairly confident there are better stocks to buy right now. We’d suggest looking at an all-weather company that owns household favorite Taco Bell.
Stocks We Like More Than Amplitude
Donald Trump’s victory in the 2024 U.S. Presidential Election sent major indices to all-time highs, but stocks have retraced as investors debate the health of the economy and the potential impact of tariffs.
While this leaves much uncertainty around 2025, a few companies are poised for long-term gains regardless of the political or macroeconomic climate, like our Top 5 Strong Momentum Stocks for this week. This is a curated list of our High Quality stocks that have generated a market-beating return of 183% over the last five years (as of March 31st 2025).
Stocks that made our list in 2020 include now familiar names such as Nvidia (+1,545% between March 2020 and March 2025) as well as under-the-radar businesses like the once-micro-cap company Tecnoglass (+1,754% five-year return). Find your next big winner with StockStory today.