Starbucks has been treading water for the past six months, holding steady at $91.90.
Is there a buying opportunity in Starbucks, or does it present a risk to your portfolio? Dive into our full research report to see our analyst team’s opinion, it’s free.
Why Is Starbucks Not Exciting?
We're cautious about Starbucks. Here are three reasons why we avoid SBUX and a stock we'd rather own.
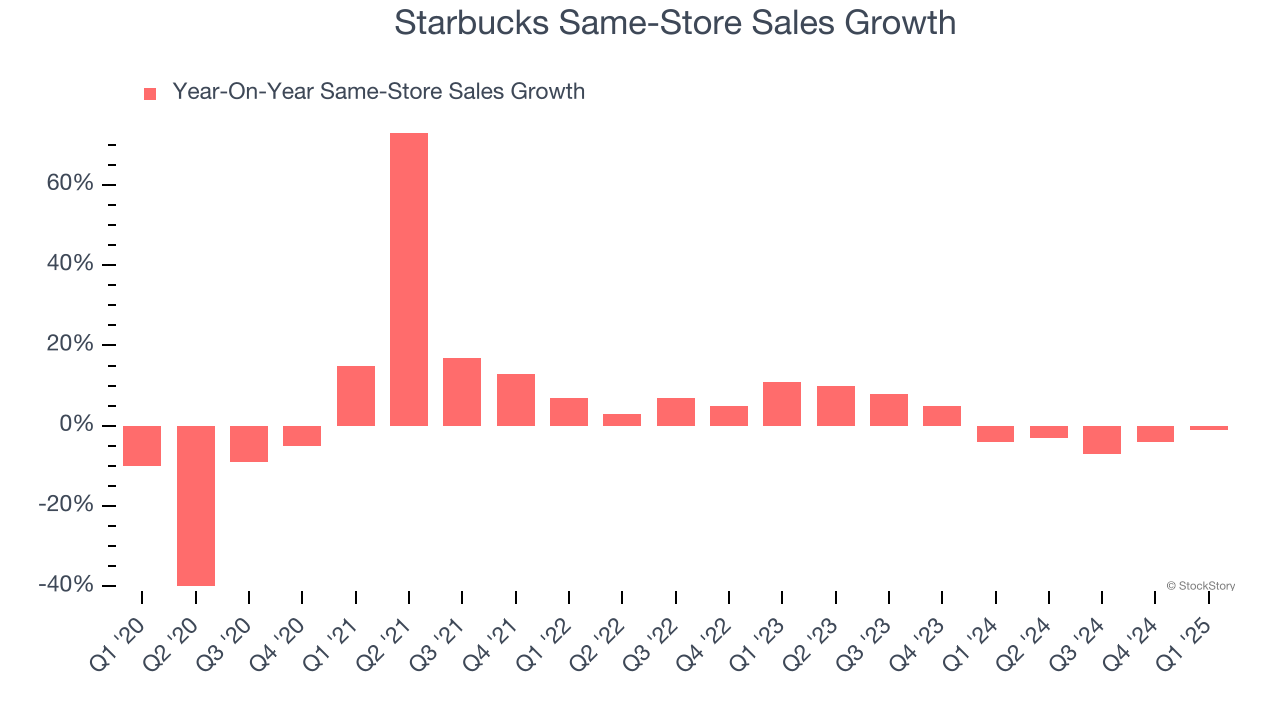
1. Flat Same-Store Sales Indicate Weak Demand
Same-store sales is a key performance indicator used to measure organic growth at restaurants open for at least a year.
Starbucks’s demand within its existing dining locations has barely increased over the last two years as its same-store sales were flat.
2. Projected Revenue Growth Is Slim
Forecasted revenues by Wall Street analysts signal a company’s potential. Predictions may not always be accurate, but accelerating growth typically boosts valuation multiples and stock prices while slowing growth does the opposite.
Over the next 12 months, sell-side analysts expect Starbucks’s revenue to rise by 4.3%, a slight deceleration versus This projection doesn't excite us and suggests its menu offerings will see some demand headwinds.
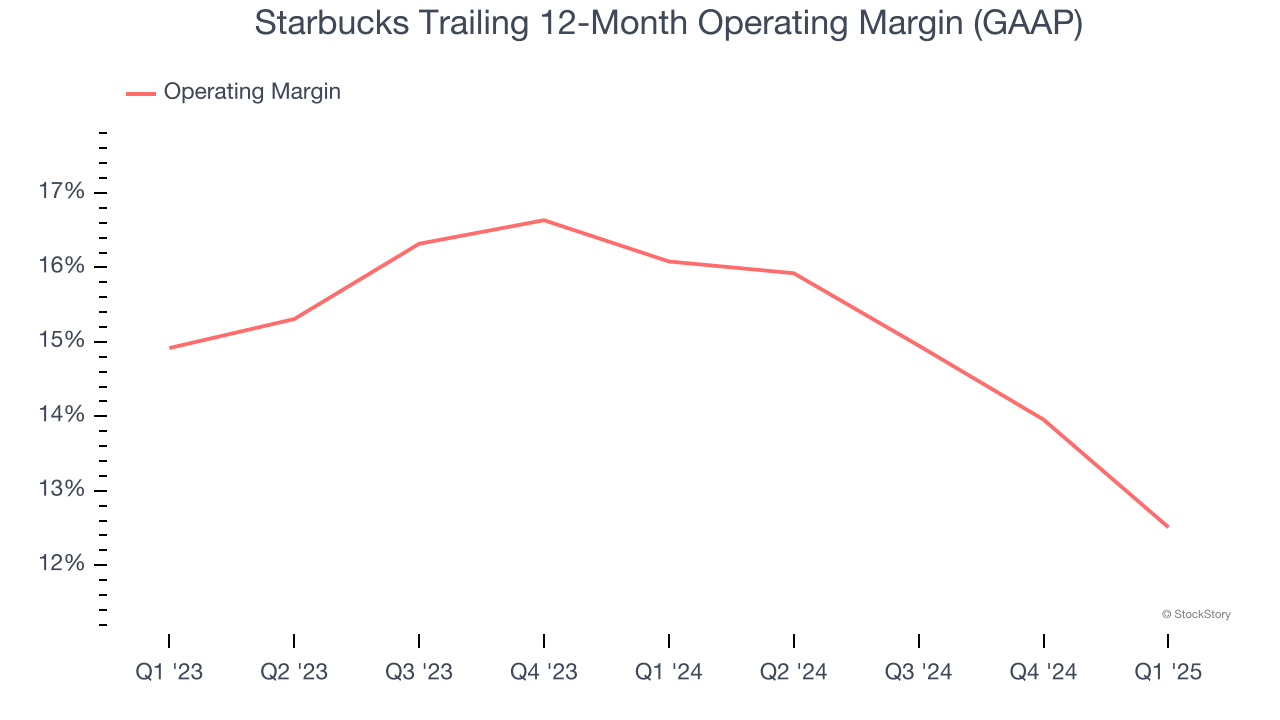
3. Shrinking Operating Margin
Operating margin is an important measure of profitability as it shows the portion of revenue left after accounting for all core expenses – everything from the cost of goods sold to advertising and wages. It’s also useful for comparing profitability across companies with different levels of debt and tax rates because it excludes interest and taxes.
Looking at the trend in its profitability, Starbucks’s operating margin decreased by 3.6 percentage points over the last year. This raises questions about the company’s expense base because its revenue growth should have given it leverage on its fixed costs, resulting in better economies of scale and profitability. Its operating margin for the trailing 12 months was 12.5%.
Final Judgment
Starbucks’s business quality ultimately falls short of our standards. That said, the stock currently trades at 29.1× forward P/E (or $91.90 per share). This valuation tells us it’s a bit of a market darling with a lot of good news priced in - you can find more timely opportunities elsewhere. We’d recommend looking at one of our top software and edge computing picks.
High-Quality Stocks for All Market Conditions
Market indices reached historic highs following Donald Trump’s presidential victory in November 2024, but the outlook for 2025 is clouded by new trade policies that could impact business confidence and growth.
While this has caused many investors to adopt a "fearful" wait-and-see approach, we’re leaning into our best ideas that can grow regardless of the political or macroeconomic climate. Take advantage of Mr. Market by checking out our Top 5 Growth Stocks for this month. This is a curated list of our High Quality stocks that have generated a market-beating return of 183% over the last five years (as of March 31st 2025).
Stocks that made our list in 2020 include now familiar names such as Nvidia (+1,545% between March 2020 and March 2025) as well as under-the-radar businesses like the once-micro-cap company Kadant (+351% five-year return). Find your next big winner with StockStory today.