Over the past six months, Mohawk Industries’s stock price fell to $103.35. Shareholders have lost 13% of their capital, which is disappointing considering the S&P 500 has climbed by 2.8%. This was partly due to its softer quarterly results and may have investors wondering how to approach the situation.
Is now the time to buy Mohawk Industries, or should you be careful about including it in your portfolio? See what our analysts have to say in our full research report, it’s free.
Why Do We Think Mohawk Industries Will Underperform?
Despite the more favorable entry price, we're cautious about Mohawk Industries. Here are three reasons why there are better opportunities than MHK and a stock we'd rather own.
1. Core Business Falling Behind as Demand Declines
In addition to reported revenue, organic revenue is a useful data point for analyzing Home Furnishings companies. This metric gives visibility into Mohawk Industries’s core business because it excludes one-time events such as mergers, acquisitions, and divestitures along with foreign currency fluctuations - non-fundamental factors that can manipulate the income statement.
Over the last two years, Mohawk Industries’s organic revenue averaged 4.3% year-on-year declines. This performance was underwhelming and implies it may need to improve its products, pricing, or go-to-market strategy. It also suggests Mohawk Industries might have to lean into acquisitions to grow, which isn’t ideal because M&A can be expensive and risky (integrations often disrupt focus). 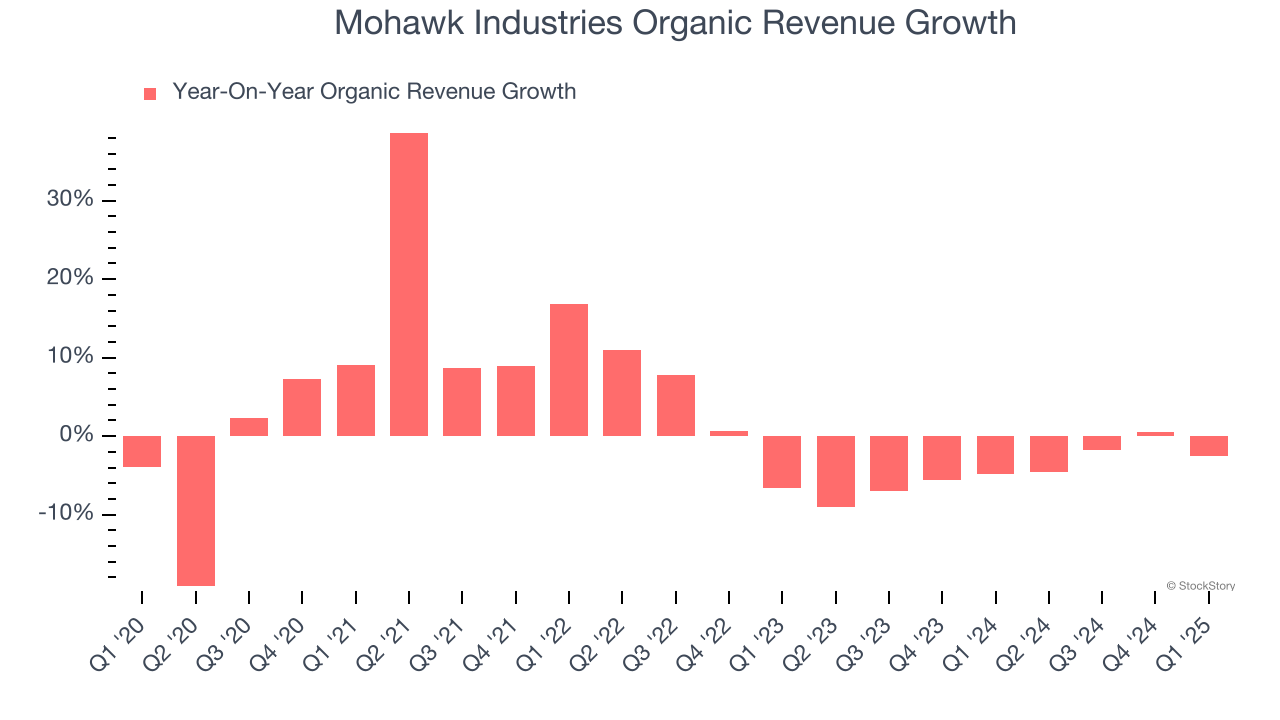
2. Previous Growth Initiatives Haven’t Impressed
Growth gives us insight into a company’s long-term potential, but how capital-efficient was that growth? Enter ROIC, a metric showing how much operating profit a company generates relative to the money it has raised (debt and equity).
Mohawk Industries historically did a mediocre job investing in profitable growth initiatives. Its five-year average ROIC was 3.5%, lower than the typical cost of capital (how much it costs to raise money) for consumer discretionary companies.
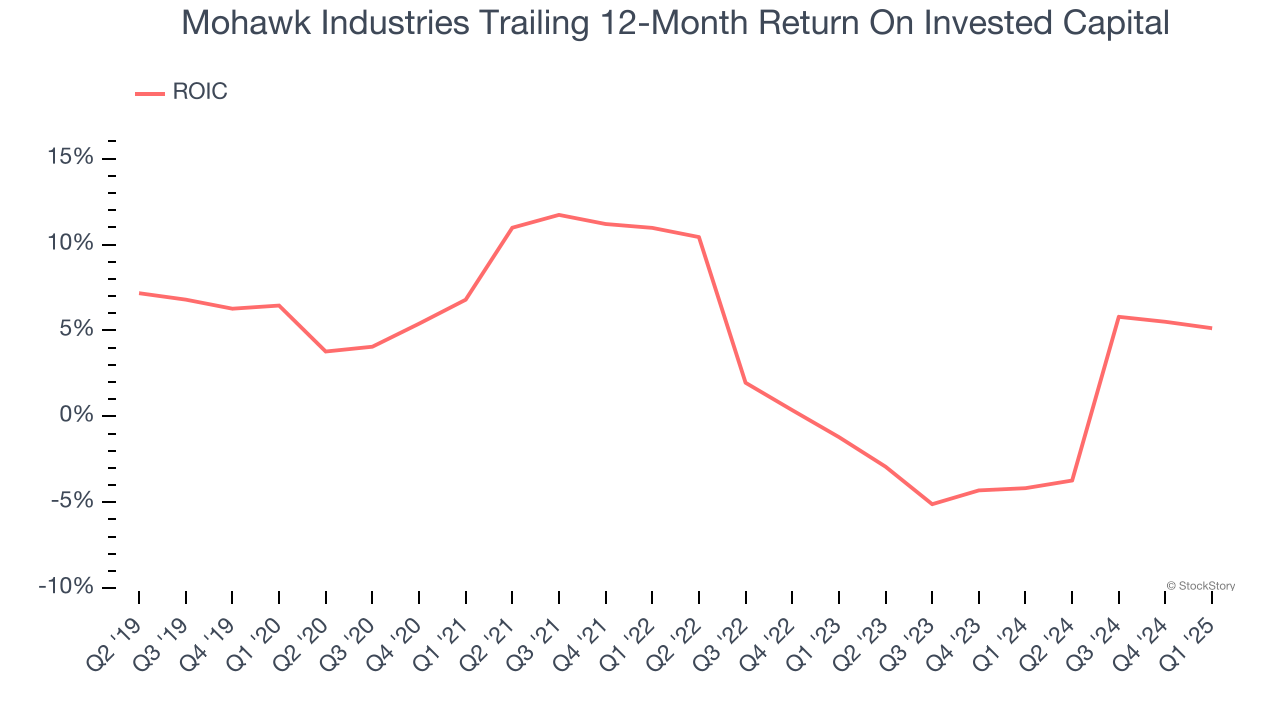
3. New Investments Fail to Bear Fruit as ROIC Declines
ROIC, or return on invested capital, is a metric showing how much operating profit a company generates relative to the money it has raised (debt and equity).
We like to invest in businesses with high returns, but the trend in a company’s ROIC is what often surprises the market and moves the stock price. Over the last few years, Mohawk Industries’s ROIC has unfortunately decreased. Paired with its already low returns, these declines suggest its profitable growth opportunities are few and far between.

Final Judgment
Mohawk Industries falls short of our quality standards. Following the recent decline, the stock trades at 10.1× forward P/E (or $103.35 per share). While this valuation is fair, the upside isn’t great compared to the potential downside. There are superior stocks to buy right now. We’d recommend looking at one of our top digital advertising picks.
Stocks We Would Buy Instead of Mohawk Industries
The market surged in 2024 and reached record highs after Donald Trump’s presidential victory in November, but questions about new economic policies are adding much uncertainty for 2025.
While the crowd speculates what might happen next, we’re homing in on the companies that can succeed regardless of the political or macroeconomic environment. Put yourself in the driver’s seat and build a durable portfolio by checking out our Top 6 Stocks for this week. This is a curated list of our High Quality stocks that have generated a market-beating return of 183% over the last five years (as of March 31st 2025).
Stocks that made our list in 2020 include now familiar names such as Nvidia (+1,545% between March 2020 and March 2025) as well as under-the-radar businesses like the once-micro-cap company Kadant (+351% five-year return). Find your next big winner with StockStory today.