
Penumbra currently trades at $256.16 per share and has shown little upside over the past six months, posting a middling return of 4.5%. However, the stock is beating the S&P 500’s 1.9% decline during that period.
Is now the time to buy Penumbra, or should you be careful about including it in your portfolio? See what our analysts have to say in our full research report, it’s free.
Why Is Penumbra Not Exciting?
Even with the strong relative performance, we don't have much confidence in Penumbra. Here are three reasons why we avoid PEN and a stock we'd rather own.
1. Fewer Distribution Channels Limit its Ceiling
Larger companies benefit from economies of scale, where fixed costs like infrastructure, technology, and administration are spread over a higher volume of goods or services, reducing the cost per unit. Scale can also lead to bargaining power with suppliers, greater brand recognition, and more investment firepower. A virtuous cycle can ensue if a scaled company plays its cards right.
With just $1.24 billion in revenue over the past 12 months, Penumbra is a small company in an industry where scale matters. This makes it difficult to build trust with customers because healthcare is heavily regulated, complex, and resource-intensive.
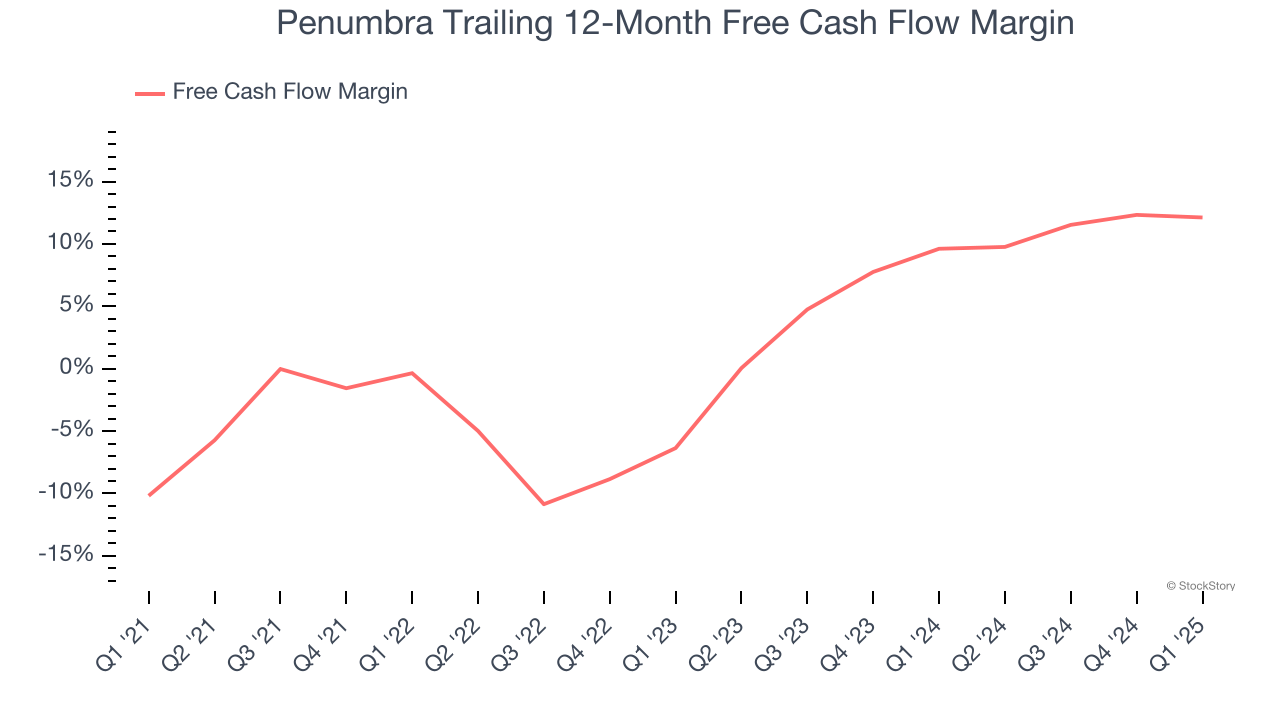
2. Mediocre Free Cash Flow Margin Limits Reinvestment Potential
Free cash flow isn't a prominently featured metric in company financials and earnings releases, but we think it's telling because it accounts for all operating and capital expenses, making it tough to manipulate. Cash is king.
Penumbra has shown mediocre cash profitability over the last five years, giving the company limited opportunities to return capital to shareholders. Its free cash flow margin averaged 3%, subpar for a healthcare business.
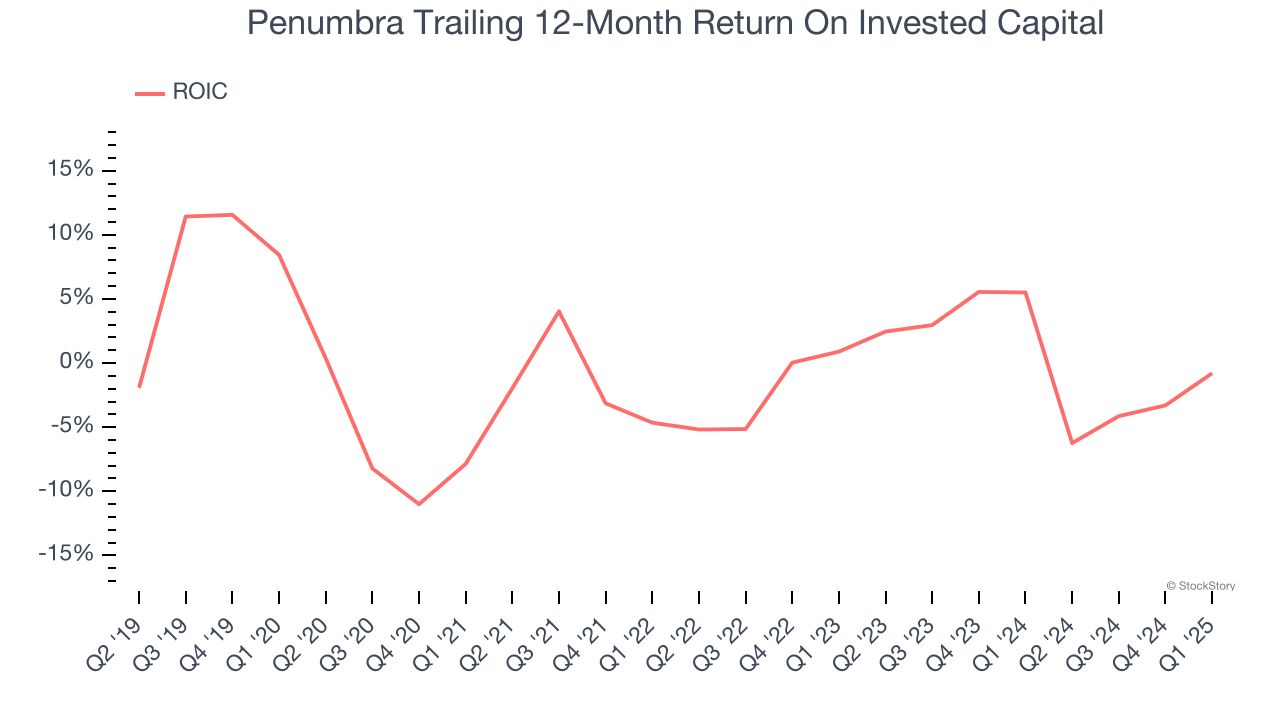
3. Previous Growth Initiatives Have Lost Money
Growth gives us insight into a company’s long-term potential, but how capital-efficient was that growth? Enter ROIC, a metric showing how much operating profit a company generates relative to the money it has raised (debt and equity).
Penumbra’s five-year average ROIC was negative 1.4%, meaning management lost money while trying to expand the business. Investors are likely hoping for a change soon.
Final Judgment
Penumbra isn’t a terrible business, but it isn’t one of our picks. Following its recent outperformance in a weaker market environment, the stock trades at 64× forward P/E (or $256.16 per share). At this valuation, there’s a lot of good news priced in - we think there are better investment opportunities out there. Let us point you toward our favorite semiconductor picks and shovels play.
Stocks We Would Buy Instead of Penumbra
Donald Trump’s victory in the 2024 U.S. Presidential Election sent major indices to all-time highs, but stocks have retraced as investors debate the health of the economy and the potential impact of tariffs.
While this leaves much uncertainty around 2025, a few companies are poised for long-term gains regardless of the political or macroeconomic climate, like our Top 9 Market-Beating Stocks. This is a curated list of our High Quality stocks that have generated a market-beating return of 183% over the last five years (as of March 31st 2025).
Stocks that made our list in 2020 include now familiar names such as Nvidia (+1,545% between March 2020 and March 2025) as well as under-the-radar businesses like the once-small-cap company Exlservice (+354% five-year return). Find your next big winner with StockStory today.
