
Discount retail company Ollie’s Bargain Outlet (NASDAQ: OLLI) reported Q1 CY2025 results topping the market’s revenue expectations, with sales up 13.4% year on year to $576.8 million. The company expects the full year’s revenue to be around $2.59 billion, close to analysts’ estimates. Its non-GAAP profit of $0.75 per share was 5.8% above analysts’ consensus estimates.
Is now the time to buy Ollie's? Find out by accessing our full research report, it’s free.
Ollie's (OLLI) Q1 CY2025 Highlights:
- Revenue: $576.8 million vs analyst estimates of $566.2 million (13.4% year-on-year growth, 1.9% beat)
- Adjusted EPS: $0.75 vs analyst estimates of $0.71 (5.8% beat)
- Adjusted EBITDA: $72.16 million vs analyst estimates of $68.28 million (12.5% margin, 5.7% beat)
- The company slightly lifted its revenue guidance for the full year to $2.59 billion at the midpoint from $2.58 billion
- Management reiterated its full-year Adjusted EPS guidance of $3.70 at the midpoint
- Operating Margin: 9.7%, down from 11.1% in the same quarter last year
- Free Cash Flow Margin: 0.3%, down from 2.6% in the same quarter last year
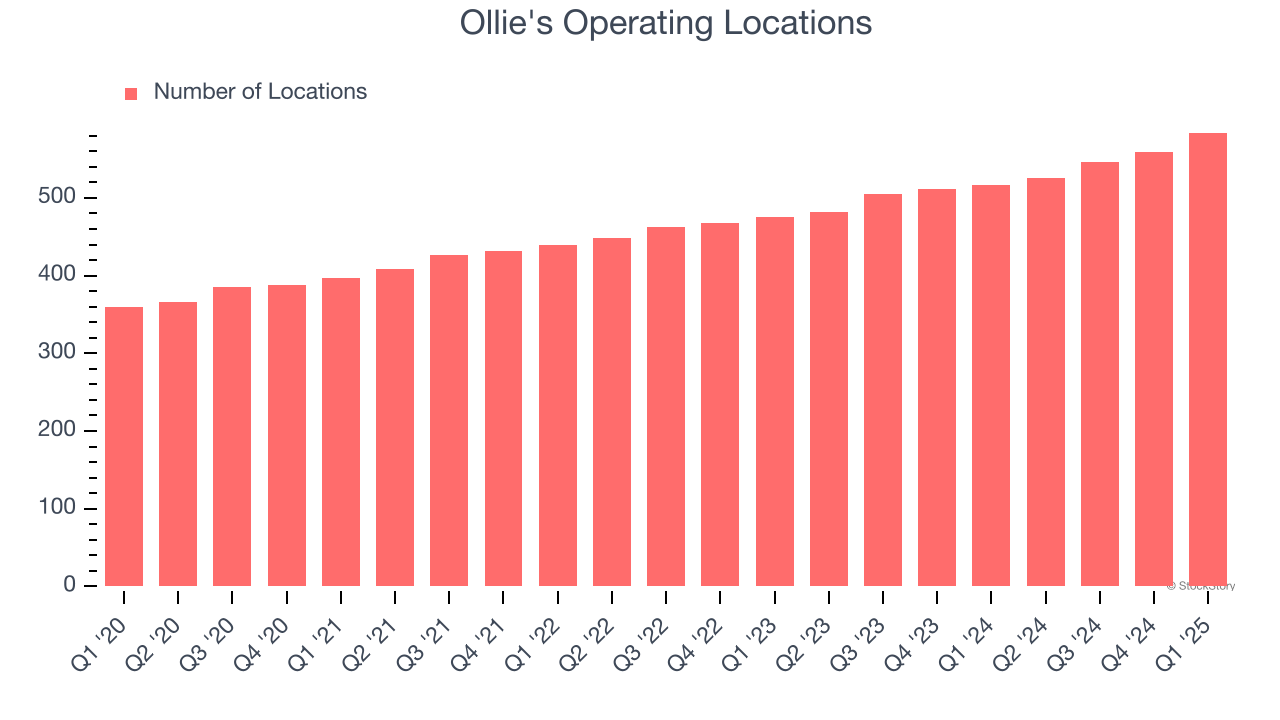
- Locations: 584 at quarter end, up from 516 in the same quarter last year
- Same-Store Sales rose 2.6% year on year, in line with the same quarter last year
- Market Capitalization: $6.87 billion
“We had a strong first quarter, highlighted by accelerated store growth and better than expected sales and earnings,” said Eric van der Valk, President and Chief Executive Officer.
Company Overview
Often located in suburban or semi-rural shopping centers, Ollie’s Bargain Outlet (NASDAQ: OLLI) is a discount retailer that acquires excess inventory then sells at meaningful discounts.
Sales Growth
A company’s long-term sales performance can indicate its overall quality. Any business can put up a good quarter or two, but the best consistently grow over the long haul.
With $2.34 billion in revenue over the past 12 months, Ollie's is a small retailer, which sometimes brings disadvantages compared to larger competitors benefiting from economies of scale and negotiating leverage with suppliers. On the bright side, it can grow faster because it has more white space to build new stores.
As you can see below, Ollie's grew its sales at a decent 10.4% compounded annual growth rate over the last six years (we compare to 2019 to normalize for COVID-19 impacts) as it opened new stores and increased sales at existing, established locations.
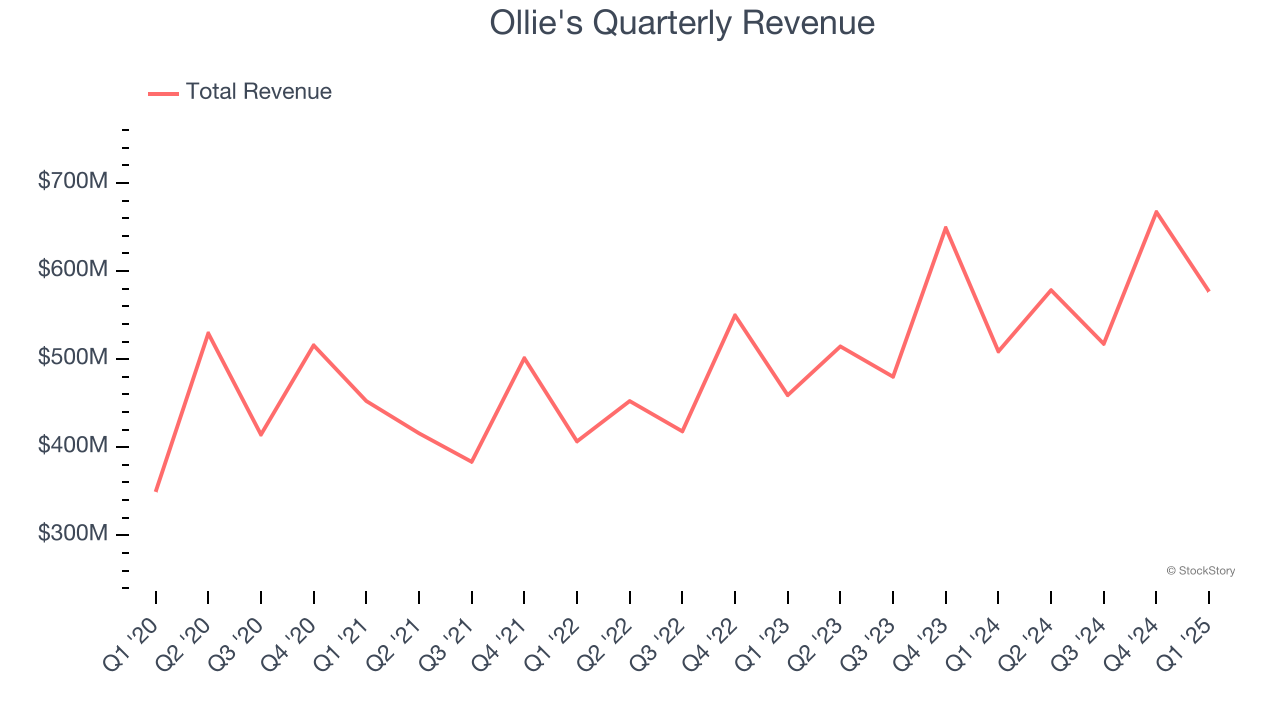
This quarter, Ollie's reported year-on-year revenue growth of 13.4%, and its $576.8 million of revenue exceeded Wall Street’s estimates by 1.9%.
Looking ahead, sell-side analysts expect revenue to grow 13.4% over the next 12 months, an acceleration versus the last six years. This projection is eye-popping and indicates its newer products will fuel better top-line performance.
Today’s young investors won’t have read the timeless lessons in Gorilla Game: Picking Winners In High Technology because it was written more than 20 years ago when Microsoft and Apple were first establishing their supremacy. But if we apply the same principles, then enterprise software stocks leveraging their own generative AI capabilities may well be the Gorillas of the future. So, in that spirit, we are excited to present our Special Free Report on a profitable, fast-growing enterprise software stock that is already riding the automation wave and looking to catch the generative AI next.
Store Performance
Number of Stores
The number of stores a retailer operates is a critical driver of how quickly company-level sales can grow.
Ollie's operated 584 locations in the latest quarter. It has opened new stores at a rapid clip over the last two years, averaging 9.2% annual growth, much faster than the broader consumer retail sector. This gives it a chance to scale into a mid-sized business over time.
When a retailer opens new stores, it usually means it’s investing for growth because demand is greater than supply, especially in areas where consumers may not have a store within reasonable driving distance.
Same-Store Sales
The change in a company's store base only tells one side of the story. The other is the performance of its existing locations and e-commerce sales, which informs management teams whether they should expand or downsize their physical footprints. Same-store sales gives us insight into this topic because it measures organic growth for a retailer's e-commerce platform and brick-and-mortar shops that have existed for at least a year.
Ollie’s demand has been spectacular for a retailer over the last two years. On average, the company has increased its same-store sales by an impressive 4.1% per year. This performance suggests its rollout of new stores is beneficial for shareholders. We like this backdrop because it gives Ollie's multiple ways to win: revenue growth can come from new stores, e-commerce, or increased foot traffic and higher sales per customer at existing locations.
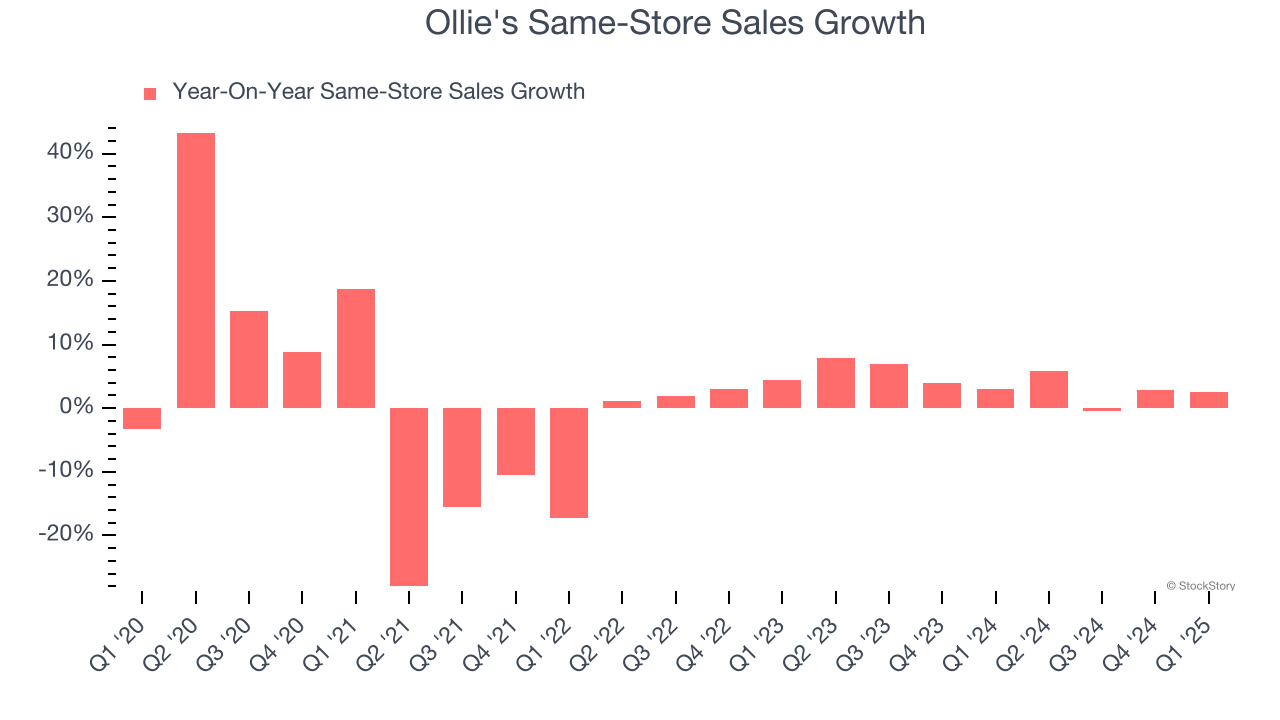
In the latest quarter, Ollie’s same-store sales rose 2.6% year on year. This growth was a deceleration from its historical levels, showing the business is still performing well but losing a bit of steam.
Key Takeaways from Ollie’s Q1 Results
We enjoyed seeing Ollie's beat analysts’ revenue, EPS, and EBITDA expectations this quarter. We were also happy it raise its full-year revenue guidance. On the other hand, its full-year EPS guidance slightly missed. Overall, this print had some key positives. Investors were likely hoping for more, and shares traded down 2.9% to $108.73 immediately after reporting.
So should you invest in Ollie's right now? We think that the latest quarter is only one piece of the longer-term business quality puzzle. Quality, when combined with valuation, can help determine if the stock is a buy. We cover that in our actionable full research report which you can read here, it’s free.


