
Regions Financial currently trades at $23.35 per share and has shown little upside over the past six months, posting a small loss of 1.3%. The stock also fell short of the S&P 500’s 4.5% gain during that period.
Is there a buying opportunity in Regions Financial, or does it present a risk to your portfolio? Get the full stock story straight from our expert analysts, it’s free.
Why Is Regions Financial Not Exciting?
We don't have much confidence in Regions Financial. Here are three reasons why we avoid RF and a stock we'd rather own.
1. Net Interest Income Points to Soft Demand
Our experience and research show the market cares primarily about a bank’s net interest income growth as non-interest income is considered a lower-quality and non-recurring revenue source.
Regions Financial’s net interest income has grown at a 5.3% annualized rate over the last four years, worse than the broader bank industry.
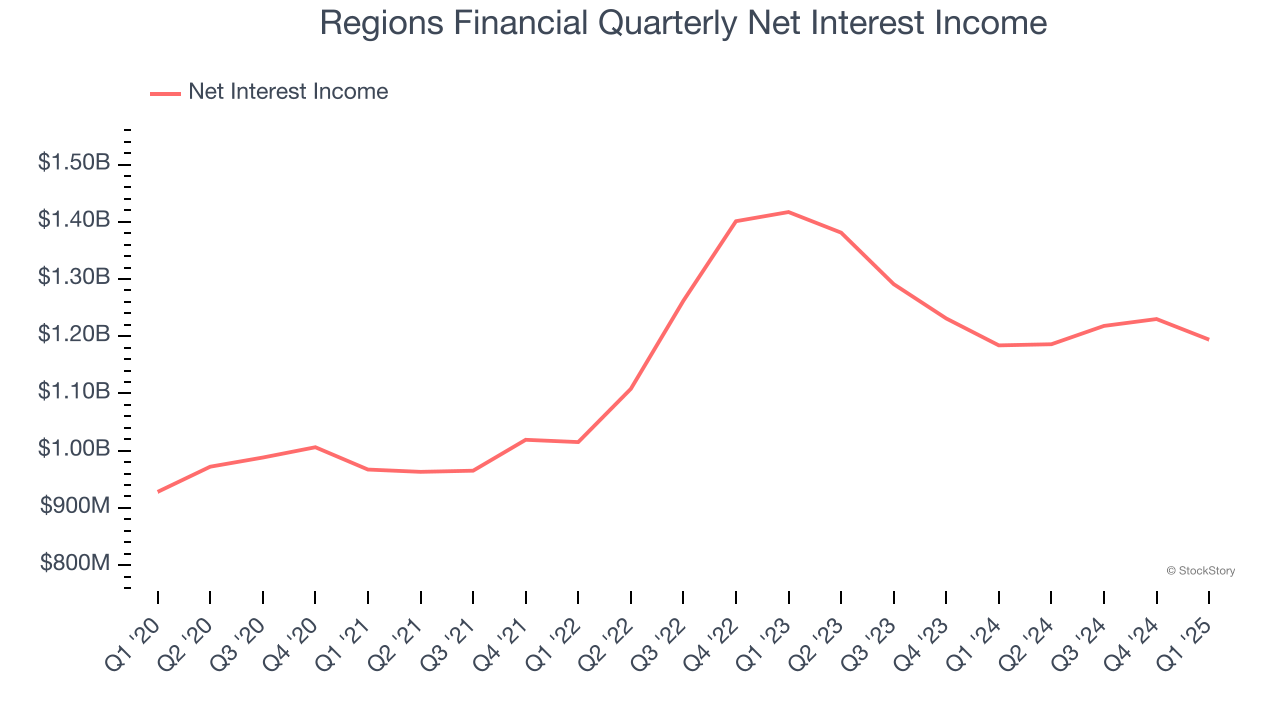
2. Projected Net Interest Income Growth Is Slim
Forecasted net interest income by Wall Street analysts signals a company’s potential. Predictions may not always be accurate, but accelerating growth typically boosts valuation multiples and stock prices while slowing growth does the opposite.
Over the next 12 months, sell-side analysts expect Regions Financial’s net interest income to rise by 3.4%.
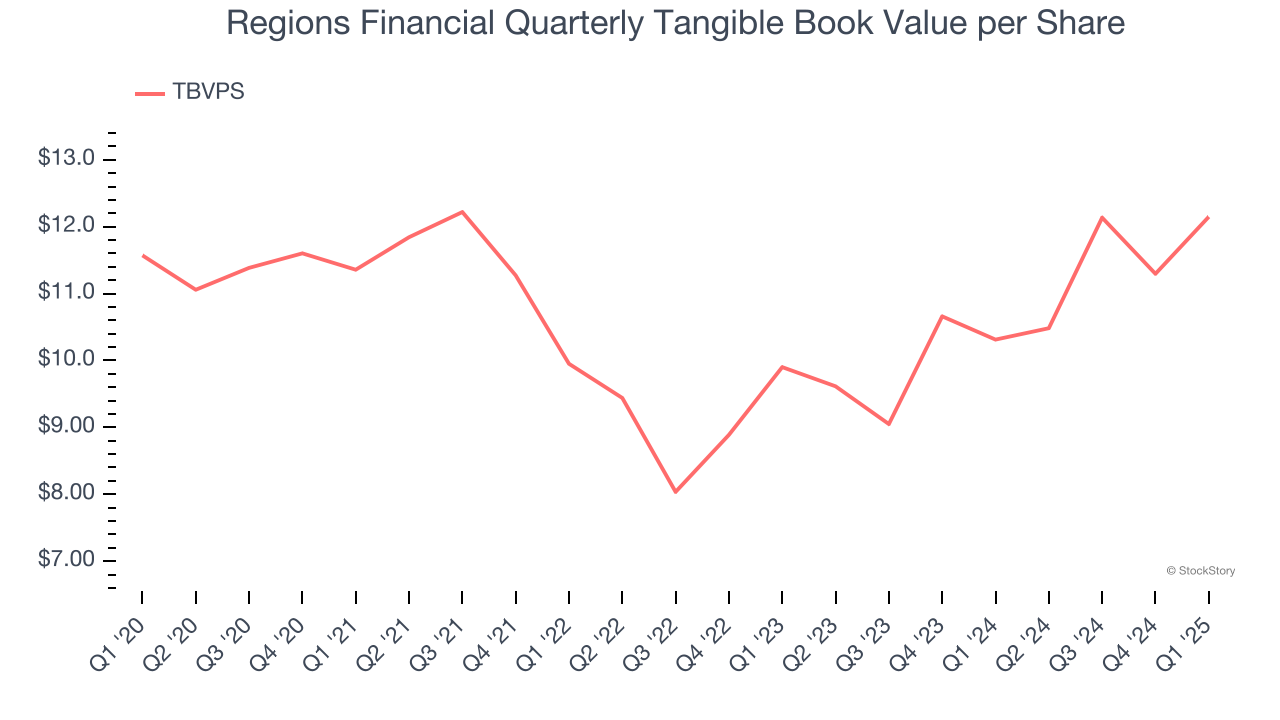
3. TBVPS Growth Demonstrates Strong Asset Foundation
Tangible book value per share (TBVPS) serves as a key indicator of a bank’s financial strength, representing the hard assets available to shareholders after removing intangible assets that could evaporate during financial distress.
Although Regions Financial’s TBVPS was flat over the last five years. the good news is that its growth has recently accelerated as TBVPS grew at a decent 10.8% annual clip over the past two years (from $9.90 to $12.15 per share).
Final Judgment
Regions Financial’s business quality ultimately falls short of our standards. With its shares underperforming the market lately, the stock trades at 1.2× forward P/B (or $23.35 per share). Beauty is in the eye of the beholder, but we don’t really see a big opportunity at the moment. We're fairly confident there are better investments elsewhere. Let us point you toward a dominant Aerospace business that has perfected its M&A strategy.
Stocks We Would Buy Instead of Regions Financial
Market indices reached historic highs following Donald Trump’s presidential victory in November 2024, but the outlook for 2025 is clouded by new trade policies that could impact business confidence and growth.
While this has caused many investors to adopt a "fearful" wait-and-see approach, we’re leaning into our best ideas that can grow regardless of the political or macroeconomic climate. Take advantage of Mr. Market by checking out our Top 5 Growth Stocks for this month. This is a curated list of our High Quality stocks that have generated a market-beating return of 183% over the last five years (as of March 31st 2025).
Stocks that made our list in 2020 include now familiar names such as Nvidia (+1,545% between March 2020 and March 2025) as well as under-the-radar businesses like the once-small-cap company Exlservice (+354% five-year return). Find your next big winner with StockStory today.