Over the past six months, Rockwell Automation has been a great trade, beating the S&P 500 by 11.1%. Its stock price has climbed to $330.21, representing a healthy 15.6% increase. This was partly thanks to its solid quarterly results, and the run-up might have investors contemplating their next move.
Is now the time to buy Rockwell Automation, or should you be careful about including it in your portfolio? Get the full breakdown from our expert analysts, it’s free.
Why Do We Think Rockwell Automation Will Underperform?
Despite the momentum, we're cautious about Rockwell Automation. Here are three reasons why you should be careful with ROK and a stock we'd rather own.
1. Core Business Falling Behind as Demand Declines
In addition to reported revenue, organic revenue is a useful data point for analyzing Internet of Things companies. This metric gives visibility into Rockwell Automation’s core business because it excludes one-time events such as mergers, acquisitions, and divestitures along with foreign currency fluctuations - non-fundamental factors that can manipulate the income statement.
Over the last two years, Rockwell Automation’s organic revenue averaged 2.2% year-on-year declines. This performance was underwhelming and implies it may need to improve its products, pricing, or go-to-market strategy. It also suggests Rockwell Automation might have to lean into acquisitions to grow, which isn’t ideal because M&A can be expensive and risky (integrations often disrupt focus). 
2. EPS Barely Growing
We track the long-term change in earnings per share (EPS) because it highlights whether a company’s growth is profitable.
Rockwell Automation’s EPS grew at a weak 1.1% compounded annual growth rate over the last five years, lower than its 3.3% annualized revenue growth. This tells us the company became less profitable on a per-share basis as it expanded.

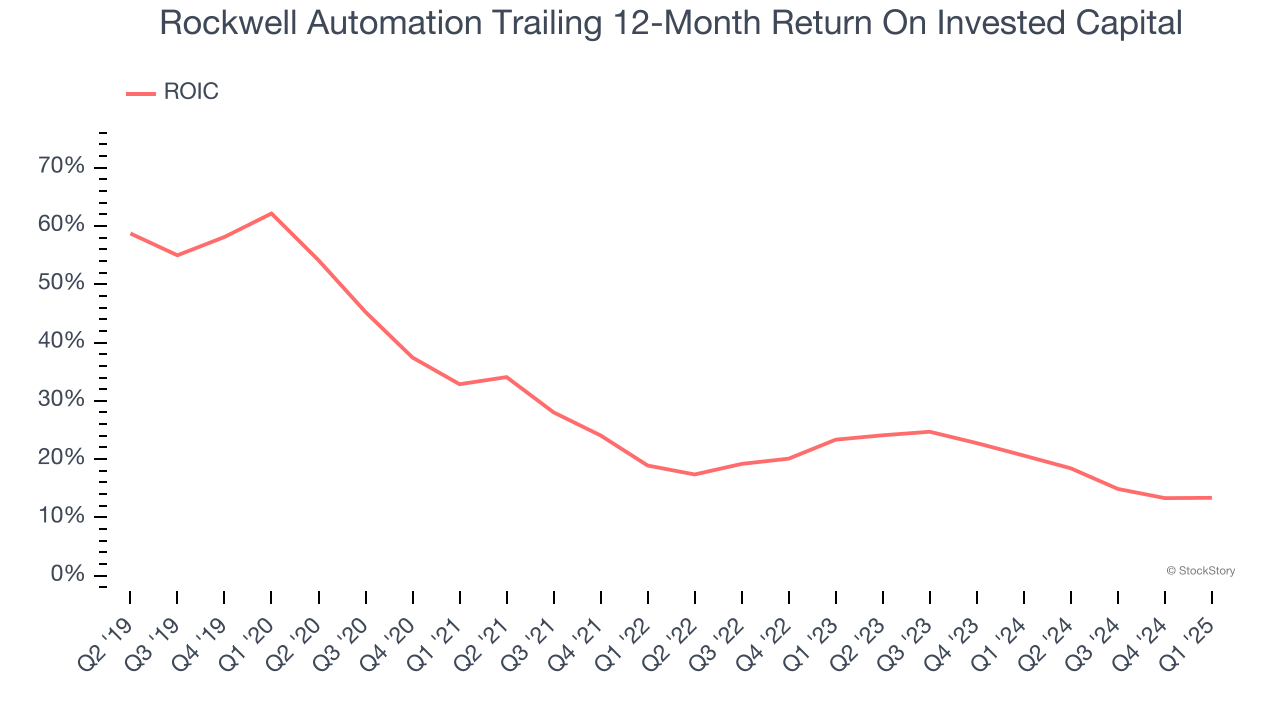
3. New Investments Fail to Bear Fruit as ROIC Declines
ROIC, or return on invested capital, is a metric showing how much operating profit a company generates relative to the money it has raised (debt and equity).
We like to invest in businesses with high returns, but the trend in a company’s ROIC is what often surprises the market and moves the stock price. Unfortunately, Rockwell Automation’s ROIC has decreased over the last few years. We like what management has done in the past, but its declining returns are perhaps a symptom of fewer profitable growth opportunities.
Final Judgment
Rockwell Automation falls short of our quality standards. With its shares beating the market recently, the stock trades at 33× forward P/E (or $330.21 per share). This multiple tells us a lot of good news is priced in - we think there are better opportunities elsewhere. We’d recommend looking at a dominant Aerospace business that has perfected its M&A strategy.
Stocks We Like More Than Rockwell Automation
The market surged in 2024 and reached record highs after Donald Trump’s presidential victory in November, but questions about new economic policies are adding much uncertainty for 2025.
While the crowd speculates what might happen next, we’re homing in on the companies that can succeed regardless of the political or macroeconomic environment. Put yourself in the driver’s seat and build a durable portfolio by checking out our Top 5 Strong Momentum Stocks for this week. This is a curated list of our High Quality stocks that have generated a market-beating return of 183% over the last five years (as of March 31st 2025).
Stocks that made our list in 2020 include now familiar names such as Nvidia (+1,545% between March 2020 and March 2025) as well as under-the-radar businesses like the once-micro-cap company Kadant (+351% five-year return). Find your next big winner with StockStory today.