
Over the past six months, Omnicom Group’s stock price fell to $71.36. Shareholders have lost 16.8% of their capital, which is disappointing considering the S&P 500 has climbed by 4.5%. This may have investors wondering how to approach the situation.
Is there a buying opportunity in Omnicom Group, or does it present a risk to your portfolio? See what our analysts have to say in our full research report, it’s free.
Why Is Omnicom Group Not Exciting?
Despite the more favorable entry price, we're sitting this one out for now. Here are three reasons why there are better opportunities than OMC and a stock we'd rather own.
1. Slow Organic Growth Suggests Waning Demand In Core Business
In addition to reported revenue, organic revenue is a useful data point for analyzing Advertising & Marketing Services companies. This metric gives visibility into Omnicom Group’s core business because it excludes one-time events such as mergers, acquisitions, and divestitures along with foreign currency fluctuations - non-fundamental factors that can manipulate the income statement.
Over the last two years, Omnicom Group’s organic revenue averaged 4.4% year-on-year growth. This performance slightly lagged the sector and suggests it may need to improve its products, pricing, or go-to-market strategy, which can add an extra layer of complexity to its operations. 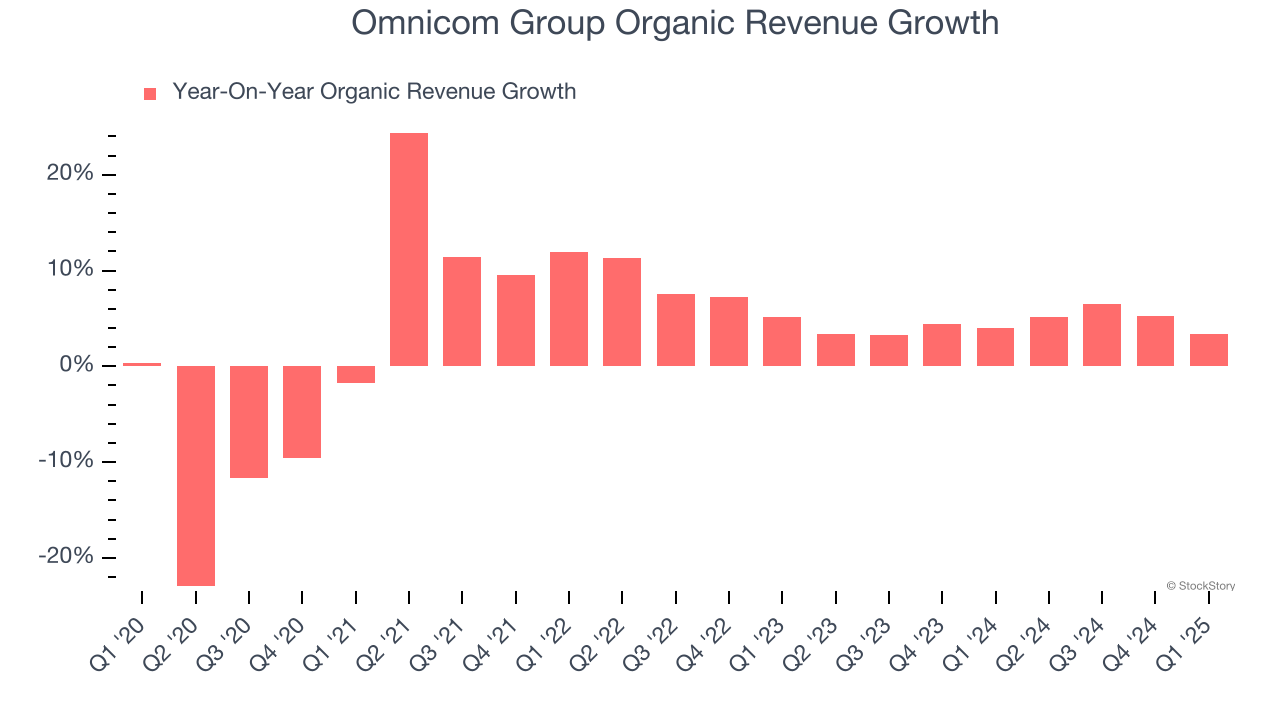
2. Projected Revenue Growth Is Slim
Forecasted revenues by Wall Street analysts signal a company’s potential. Predictions may not always be accurate, but accelerating growth typically boosts valuation multiples and stock prices while slowing growth does the opposite.
Over the next 12 months, sell-side analysts expect Omnicom Group’s revenue to rise by 2%, a slight deceleration versus its 1.1% annualized growth for the past five years. This projection is underwhelming and indicates its products and services will see some demand headwinds.
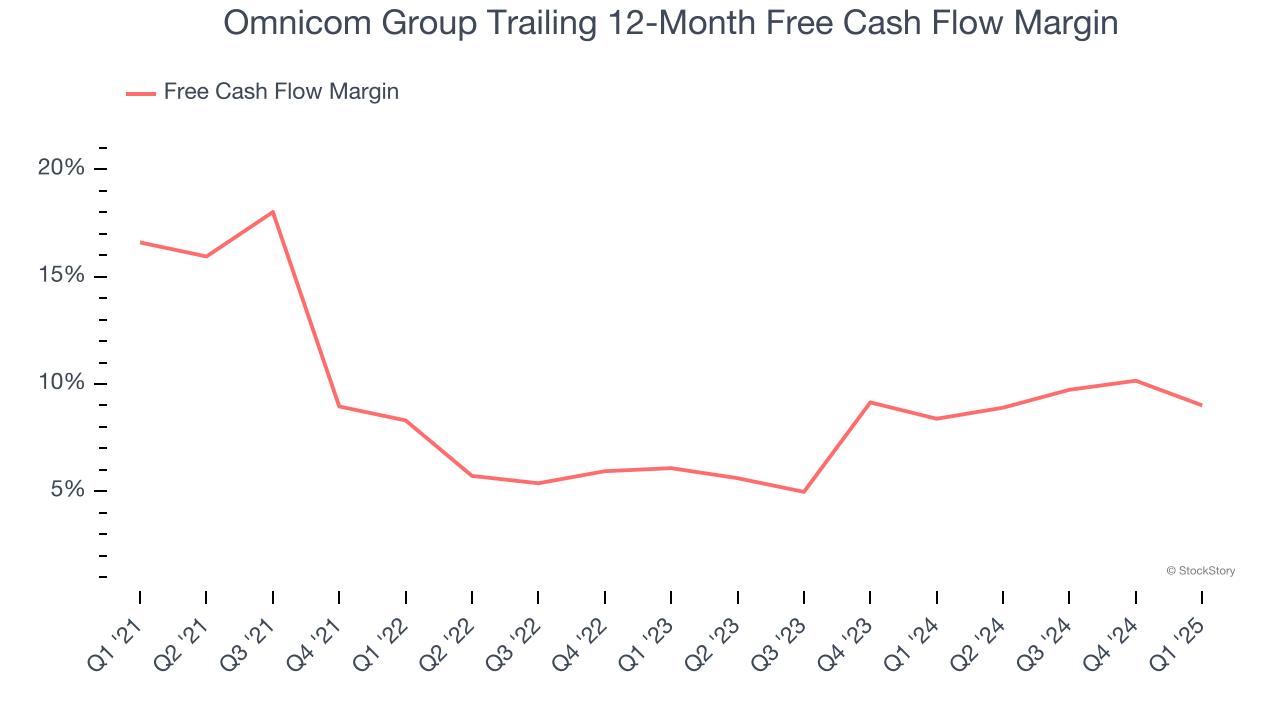
3. Free Cash Flow Margin Dropping
Free cash flow isn't a prominently featured metric in company financials and earnings releases, but we think it's telling because it accounts for all operating and capital expenses, making it tough to manipulate. Cash is king.
As you can see below, Omnicom Group’s margin dropped by 7.6 percentage points over the last five years. If its declines continue, it could signal increasing investment needs and capital intensity. Omnicom Group’s free cash flow margin for the trailing 12 months was 9%.
Final Judgment
Omnicom Group isn’t a terrible business, but it isn’t one of our picks. Following the recent decline, the stock trades at 8.4× forward P/E (or $71.36 per share). While this valuation is optically cheap, the potential downside is big given its shaky fundamentals. We're fairly confident there are better investments elsewhere. We’d recommend looking at an all-weather company that owns household favorite Taco Bell.
High-Quality Stocks for All Market Conditions
Donald Trump’s victory in the 2024 U.S. Presidential Election sent major indices to all-time highs, but stocks have retraced as investors debate the health of the economy and the potential impact of tariffs.
While this leaves much uncertainty around 2025, a few companies are poised for long-term gains regardless of the political or macroeconomic climate, like our Top 9 Market-Beating Stocks. This is a curated list of our High Quality stocks that have generated a market-beating return of 183% over the last five years (as of March 31st 2025).
Stocks that made our list in 2020 include now familiar names such as Nvidia (+1,545% between March 2020 and March 2025) as well as under-the-radar businesses like the once-micro-cap company Kadant (+351% five-year return). Find your next big winner with StockStory today.