In a sliding market, OPENLANE has defied the odds, trading up to $23.60 per share. Its 17.2% gain since December 2024 has outpaced the S&P 500’s 1.9% drop. This was partly due to its solid quarterly results, and the performance may have investors wondering how to approach the situation.
Is there a buying opportunity in OPENLANE, or does it present a risk to your portfolio? Get the full stock story straight from our expert analysts, it’s free.
Why Do We Think OPENLANE Will Underperform?
Despite the momentum, we're sitting this one out for now. Here are three reasons why there are better opportunities than KAR and a stock we'd rather own.
1. Revenue Spiraling Downwards
Examining a company’s long-term performance can provide clues about its quality. Even a bad business can shine for one or two quarters, but a top-tier one grows for years. OPENLANE struggled to consistently generate demand over the last five years as its sales dropped at a 7.9% annual rate. This wasn’t a great result and signals it’s a low quality business. 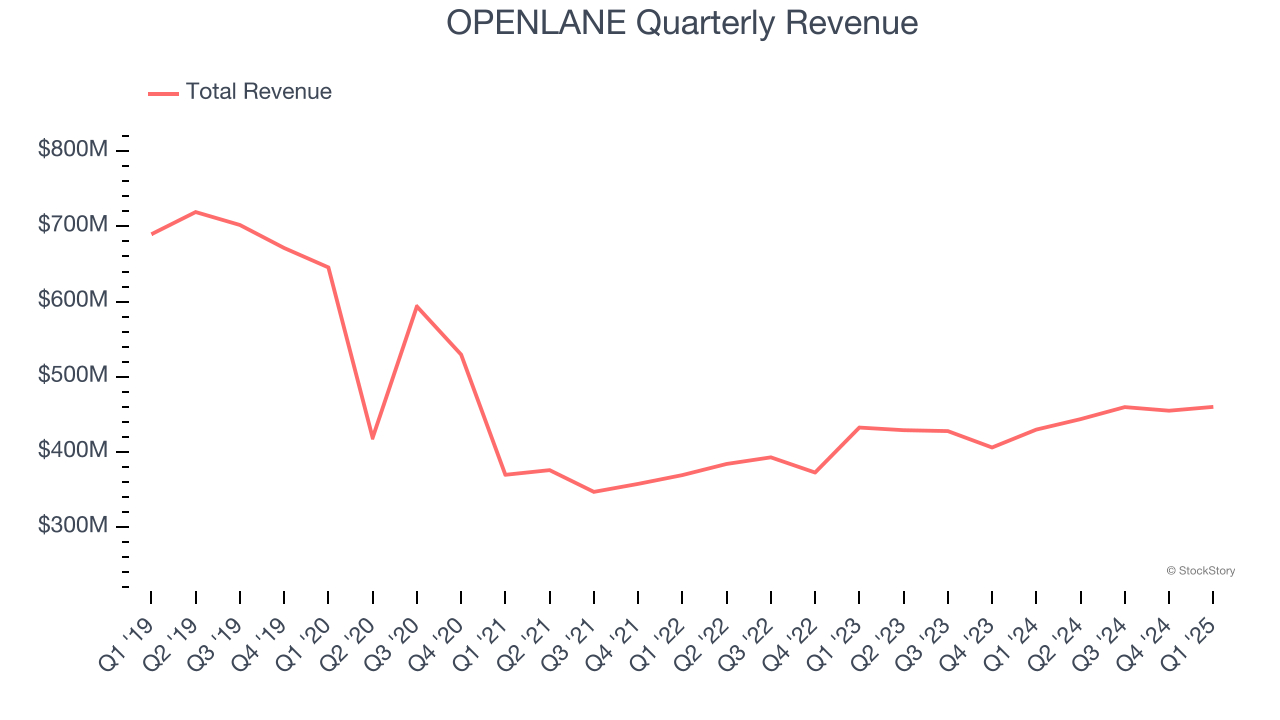
2. Free Cash Flow Margin Dropping
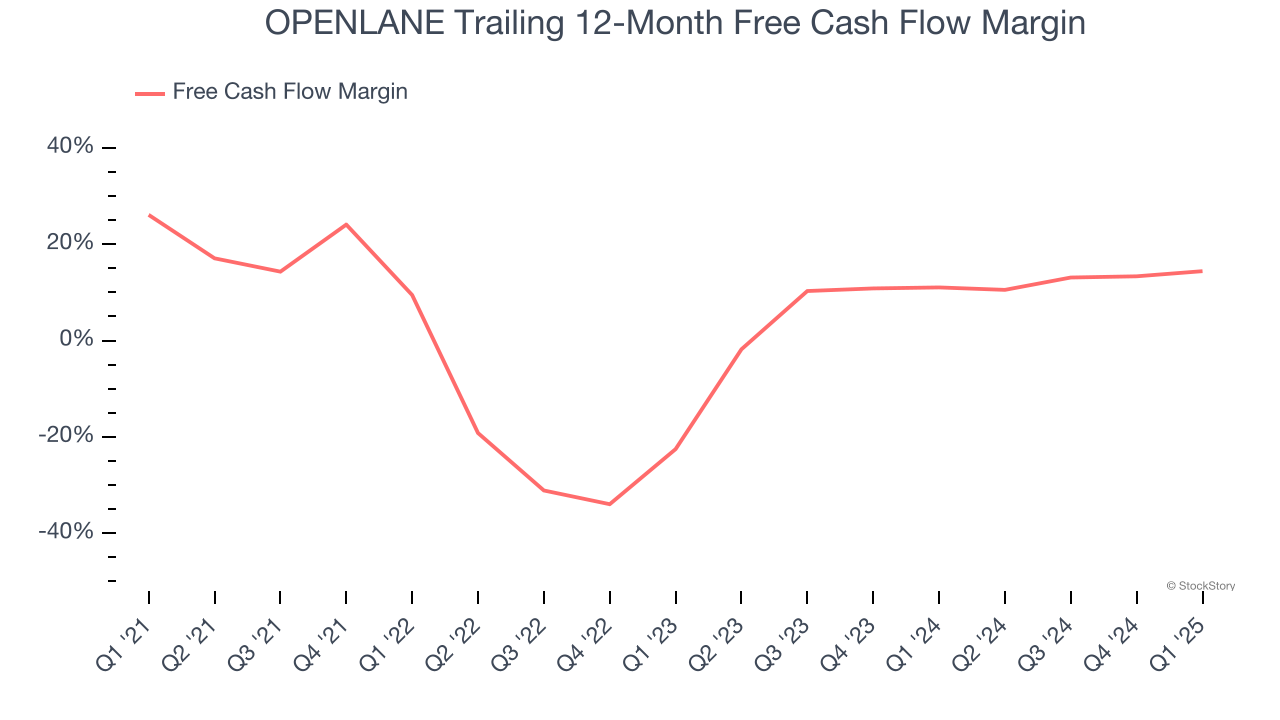
Free cash flow isn't a prominently featured metric in company financials and earnings releases, but we think it's telling because it accounts for all operating and capital expenses, making it tough to manipulate. Cash is king.
As you can see below, OPENLANE’s margin dropped by 11.7 percentage points over the last five years. It may have ticked higher more recently, but shareholders are likely hoping for its margin to at least revert to its historical level. If the longer-term trend returns, it could signal increasing investment needs and capital intensity. OPENLANE’s free cash flow margin for the trailing 12 months was 14.4%.
3. High Debt Levels Increase Risk
As long-term investors, the risk we care about most is the permanent loss of capital, which can happen when a company goes bankrupt or raises money from a disadvantaged position. This is separate from short-term stock price volatility, something we are much less bothered by.
OPENLANE’s $1.94 billion of debt exceeds the $220.5 million of cash on its balance sheet. Furthermore, its 6× net-debt-to-EBITDA ratio (based on its EBITDA of $301.4 million over the last 12 months) shows the company is overleveraged.
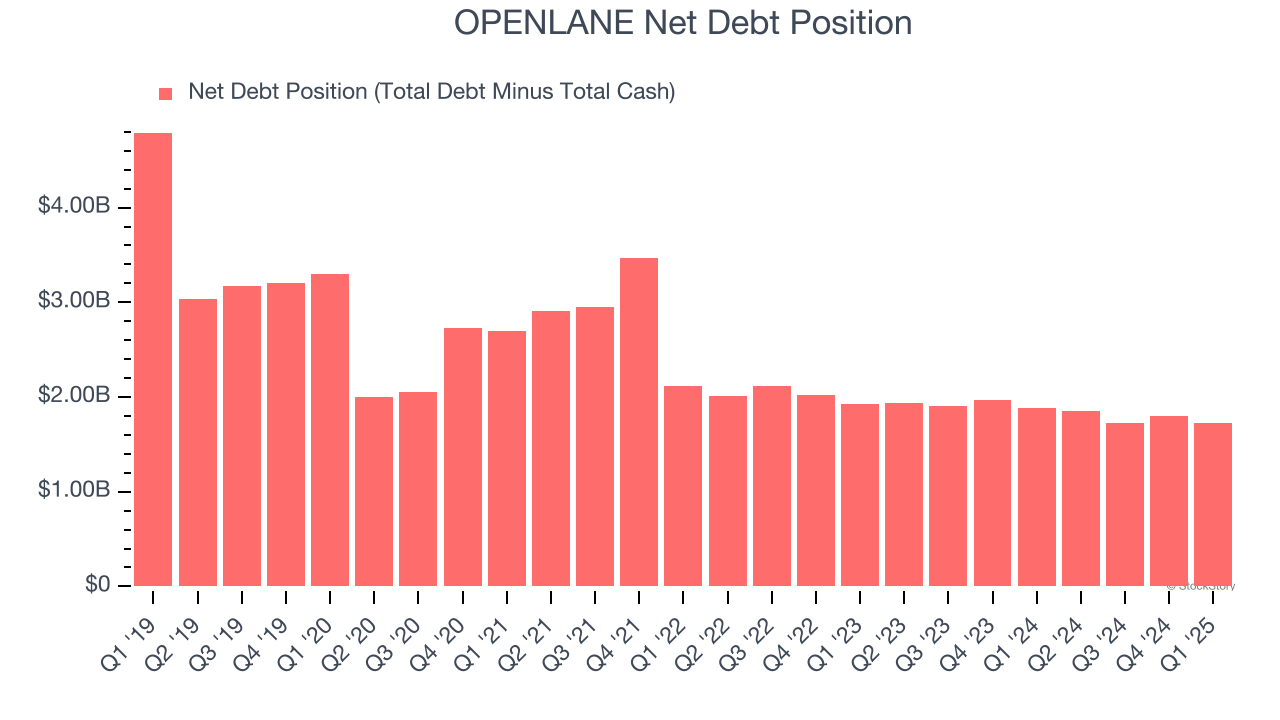
At this level of debt, incremental borrowing becomes increasingly expensive and credit agencies could downgrade the company’s rating if profitability falls. OPENLANE could also be backed into a corner if the market turns unexpectedly – a situation we seek to avoid as investors in high-quality companies.
We hope OPENLANE can improve its balance sheet and remain cautious until it increases its profitability or pays down its debt.
Final Judgment
We cheer for all companies serving everyday consumers, but in the case of OPENLANE, we’ll be cheering from the sidelines. With its shares outperforming the market lately, the stock trades at 23.5× forward P/E (or $23.60 per share). This valuation tells us it’s a bit of a market darling with a lot of good news priced in - we think there are better investment opportunities out there. Let us point you toward one of our top software and edge computing picks.
Stocks We Would Buy Instead of OPENLANE
Market indices reached historic highs following Donald Trump’s presidential victory in November 2024, but the outlook for 2025 is clouded by new trade policies that could impact business confidence and growth.
While this has caused many investors to adopt a "fearful" wait-and-see approach, we’re leaning into our best ideas that can grow regardless of the political or macroeconomic climate. Take advantage of Mr. Market by checking out our Top 5 Strong Momentum Stocks for this week. This is a curated list of our High Quality stocks that have generated a market-beating return of 183% over the last five years (as of March 31st 2025).
Stocks that made our list in 2020 include now familiar names such as Nvidia (+1,545% between March 2020 and March 2025) as well as under-the-radar businesses like the once-micro-cap company Kadant (+351% five-year return). Find your next big winner with StockStory today.


