Fashion conglomerate PVH (NYSE: PVH) reported revenue ahead of Wall Street’s expectations in Q1 CY2025, with sales up 1.6% year on year to $1.98 billion. Its non-GAAP profit of $2.30 per share was 2.2% above analysts’ consensus estimates.
Is now the time to buy PVH? Find out by accessing our full research report, it’s free.
PVH (PVH) Q1 CY2025 Highlights:
- Revenue: $1.98 billion vs analyst estimates of $1.93 billion (1.6% year-on-year growth, 2.6% beat)
- Adjusted EPS: $2.30 vs analyst estimates of $2.25 (2.2% beat)
- Adjusted EBITDA: -$264.5 million vs analyst estimates of $233.8 million (-13.3% margin, significant miss)
- Management lowered its full-year Adjusted EPS guidance to $10.88 at the midpoint, a 13.5% decrease
- Operating Margin: -16.7%, down from 10.5% in the same quarter last year
- Constant Currency Revenue rose 2% year on year (-8.7% in the same quarter last year)
- Market Capitalization: $4.34 billion
Stefan Larsson, Chief Executive Officer, commented, “In Q1, we continued to tap into the global consumer love for Calvin Klein and TOMMY HILFIGER, delivering revenue growth versus last year and ahead of guidance. Calvin Klein saw one of its most impactful product launches in years with the Icon Cotton Stretch franchise, amplified by the viral Bad Bunny campaign. TOMMY HILFIGER tapped into its lifestyle DNA with rich product storytelling around seasonal newness of Tommy classics to drive growth and built momentum for the brand’s collaboration with the biggest movie launch of the summer: F1® The Movie.”
Company Overview
Founded in 1881 by a husband and wife duo, PVH (NYSE: PVH) is a global fashion conglomerate with iconic brands like Calvin Klein and Tommy Hilfiger.
Sales Growth
Examining a company’s long-term performance can provide clues about its quality. Any business can put up a good quarter or two, but many enduring ones grow for years. Unfortunately, PVH struggled to consistently increase demand as its $8.68 billion of sales for the trailing 12 months was close to its revenue five years ago. This wasn’t a great result and is a sign of poor business quality.
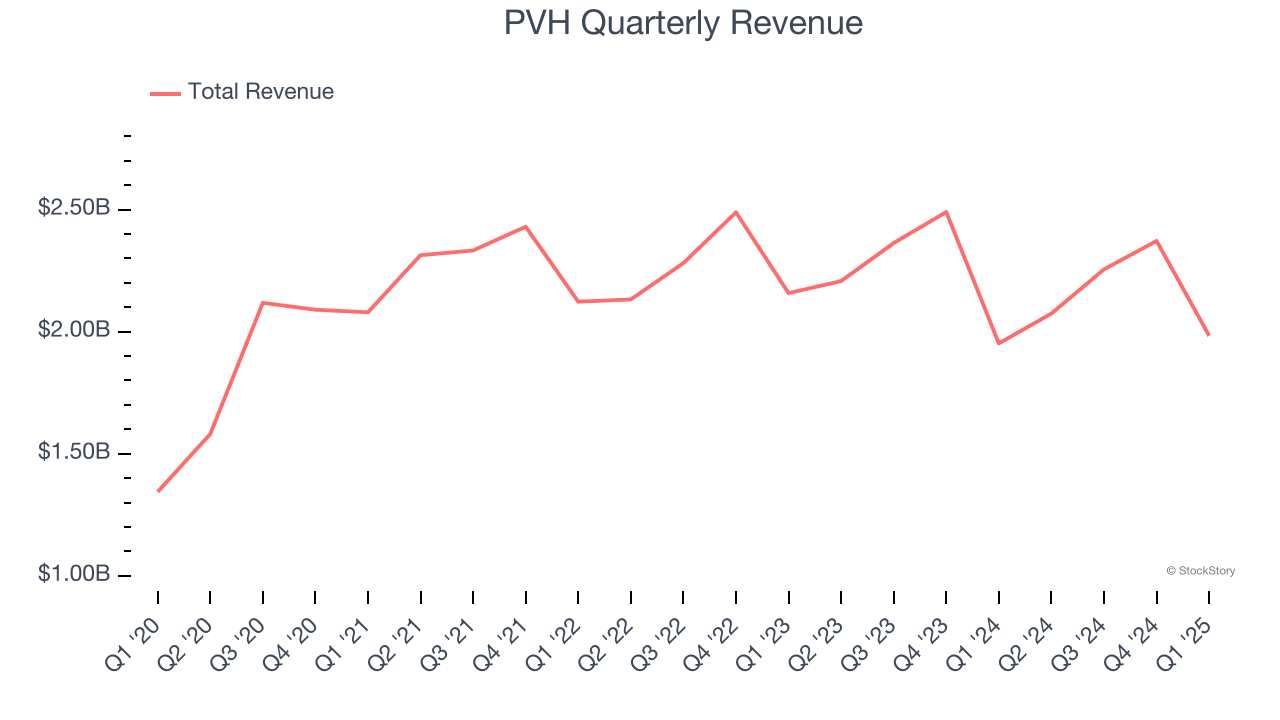
We at StockStory place the most emphasis on long-term growth, but within consumer discretionary, a stretched historical view may miss a company riding a successful new product or trend. PVH’s recent performance shows its demand remained suppressed as its revenue has declined by 2.1% annually over the last two years. 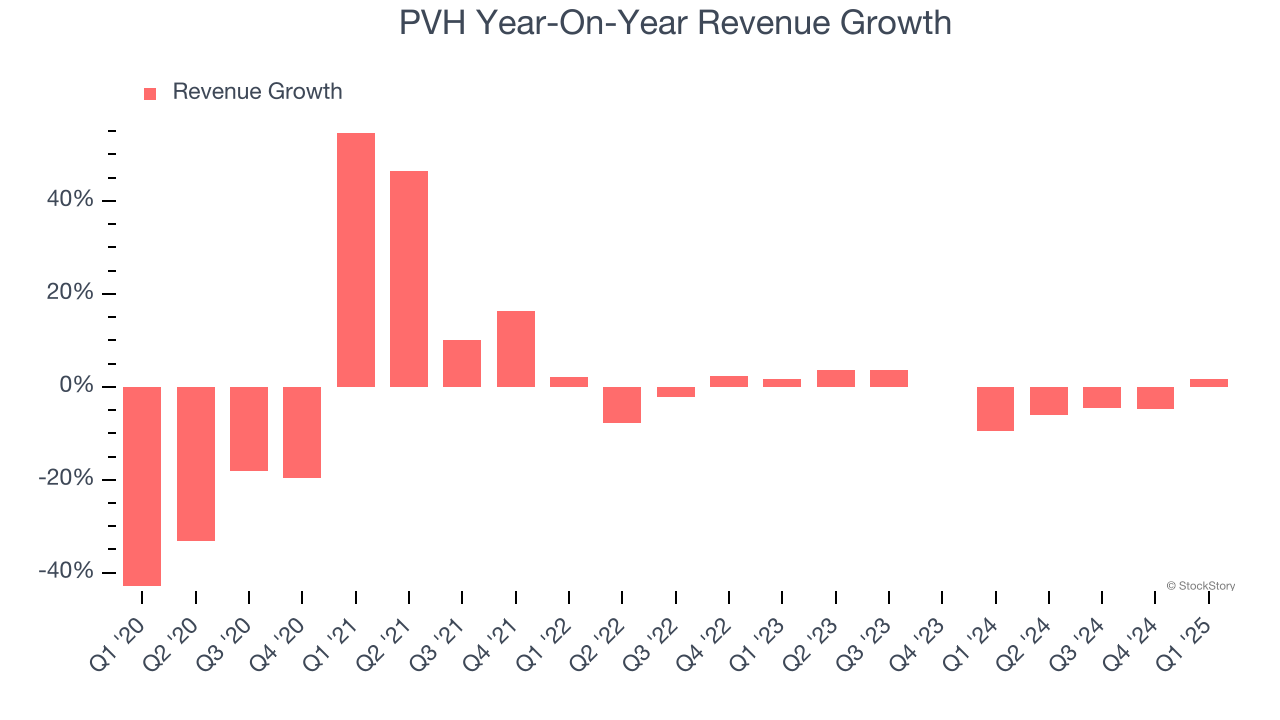
PVH also reports sales performance excluding currency movements, which are outside the company’s control and not indicative of demand. Over the last two years, its constant currency sales averaged 2.3% year-on-year declines. Because this number aligns with its normal revenue growth, we can see that PVH has properly hedged its foreign currency exposure. 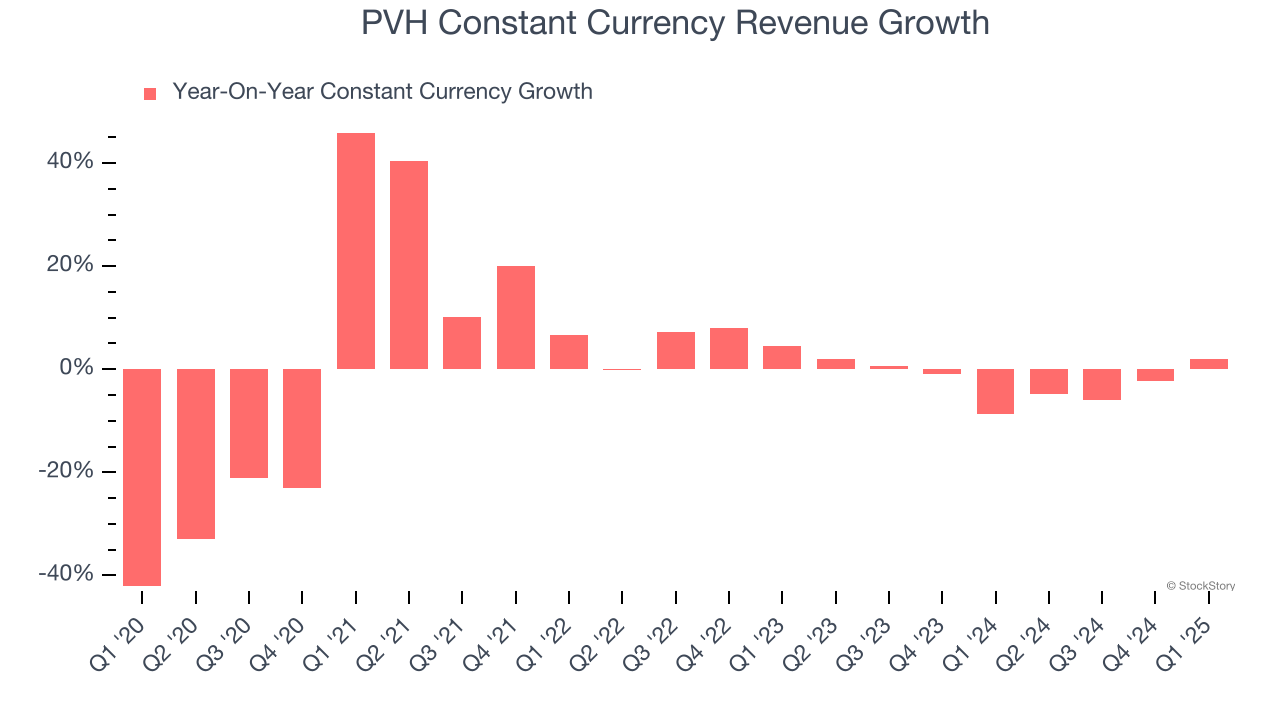
This quarter, PVH reported modest year-on-year revenue growth of 1.6% but beat Wall Street’s estimates by 2.6%.
Looking ahead, sell-side analysts expect revenue to remain flat over the next 12 months. Although this projection suggests its newer products and services will spur better top-line performance, it is still below average for the sector.
Software is eating the world and there is virtually no industry left that has been untouched by it. That drives increasing demand for tools helping software developers do their jobs, whether it be monitoring critical cloud infrastructure, integrating audio and video functionality, or ensuring smooth content streaming. Click here to access a free report on our 3 favorite stocks to play this generational megatrend.
Operating Margin
Operating margin is an important measure of profitability as it shows the portion of revenue left after accounting for all core expenses – everything from the cost of goods sold to advertising and wages. It’s also useful for comparing profitability across companies with different levels of debt and tax rates because it excludes interest and taxes.
PVH’s operating margin has shrunk over the last 12 months and averaged 6.6% over the last two years. The company’s profitability was mediocre for a consumer discretionary business and shows it couldn’t pass its higher operating expenses onto its customers.
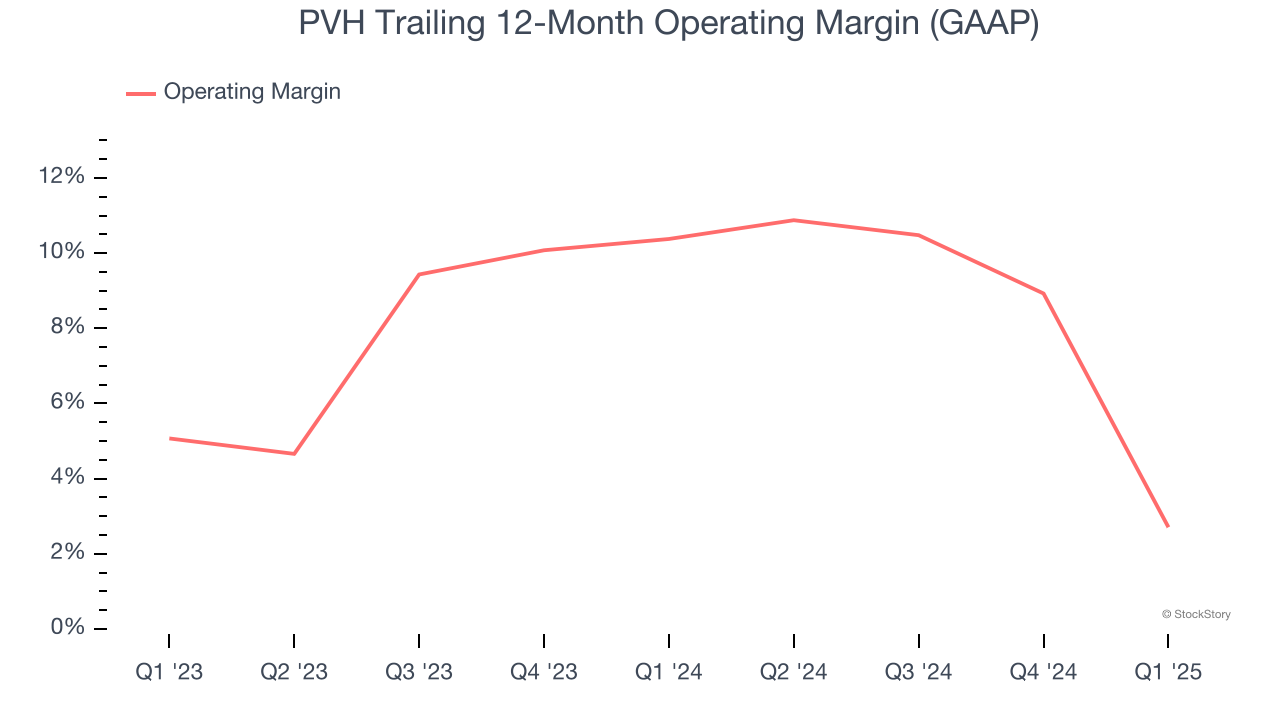
In Q1, PVH generated an operating margin profit margin of negative 16.7%, down 27.3 percentage points year on year. This contraction shows it was less efficient because its expenses grew faster than its revenue.
Earnings Per Share
We track the long-term change in earnings per share (EPS) for the same reason as long-term revenue growth. Compared to revenue, however, EPS highlights whether a company’s growth is profitable.
PVH’s EPS grew at a spectacular 23.4% compounded annual growth rate over the last five years, higher than its flat revenue. However, this alone doesn’t tell us much about its business quality because its operating margin didn’t expand.
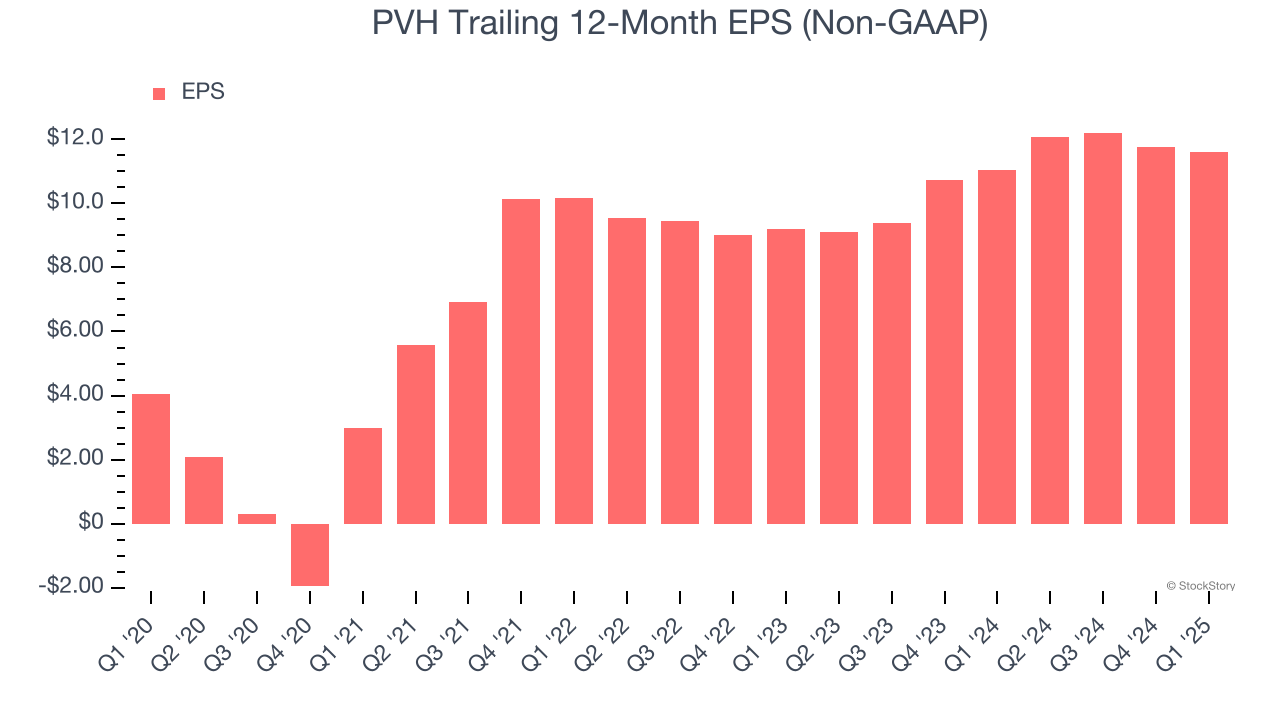
In Q1, PVH reported EPS at $2.30, down from $2.45 in the same quarter last year. Despite falling year on year, this print beat analysts’ estimates by 2.2%. Over the next 12 months, Wall Street expects PVH’s full-year EPS of $11.61 to grow 13.8%.
Key Takeaways from PVH’s Q1 Results
We enjoyed seeing PVH beat analysts’ constant currency revenue and EPS expectations this quarter. On the other hand, its EBITDA missed and it lowered its full-year EPS guidance. Overall, this was a softer quarter. The stock traded down 5.3% to $76.50 immediately after reporting.
PVH didn’t show it’s best hand this quarter, but does that create an opportunity to buy the stock right now? What happened in the latest quarter matters, but not as much as longer-term business quality and valuation, when deciding whether to invest in this stock. We cover that in our actionable full research report which you can read here, it’s free.