Young adult apparel retailer Tilly’s (NYSE: TLYS) missed Wall Street’s revenue expectations in Q1 CY2025, with sales falling 7.1% year on year to $107.6 million. On the other hand, next quarter’s outlook exceeded expectations with revenue guided to $154 million at the midpoint, or 4.6% above analysts’ estimates. Its GAAP loss of $0.74 per share was 12.1% below analysts’ consensus estimates.
Is now the time to buy Tilly's? Find out by accessing our full research report, it’s free.
Tilly's (TLYS) Q1 CY2025 Highlights:
- Revenue: $107.6 million vs analyst estimates of $108.2 million (7.1% year-on-year decline, 0.5% miss)
- EPS (GAAP): -$0.74 vs analyst expectations of -$0.66 (12.1% miss)
- Adjusted EBITDA: -$19.86 million vs analyst estimates of -$17.43 million (-18.5% margin, 14% miss)
- Revenue Guidance for Q2 CY2025 is $154 million at the midpoint, above analyst estimates of $147.2 million
- EPS (GAAP) guidance for Q2 CY2025 is -$0.01 at the midpoint, beating analyst estimates by 81.8%
- Operating Margin: -21.1%, down from -16.5% in the same quarter last year
- Free Cash Flow was -$9.64 million compared to -$27.83 million in the same quarter last year
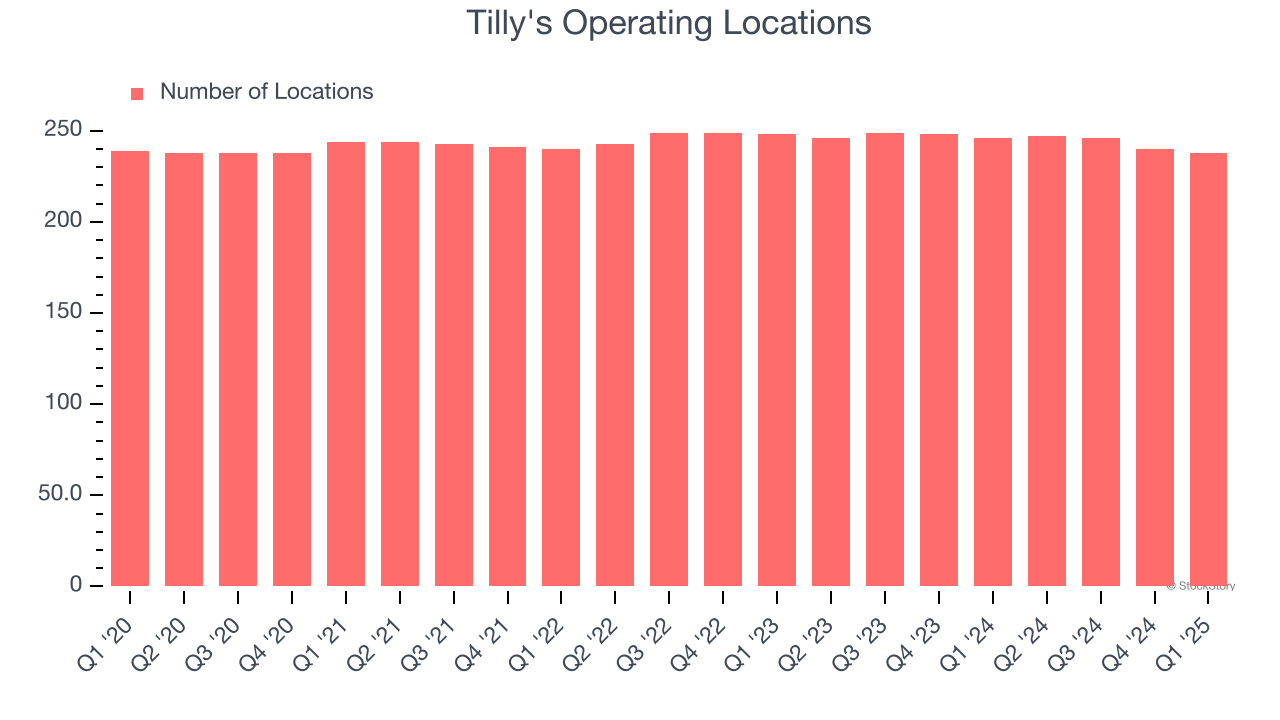
- Locations: 238 at quarter end, down from 246 in the same quarter last year
- Same-Store Sales fell 7.1% year on year (-8.6% in the same quarter last year)
- Market Capitalization: $40.4 million
"Our fiscal 2025 first quarter comparable net sales, while a decrease compared to last year's first quarter, were a sequential improvement in trend compared to the fourth quarter of fiscal 2024. Fiscal May, to start the second quarter, produced further sequential trend improvement relative to the first quarter," commented Hezy Shaked, President and Chief Executive Officer.
Company Overview
With an emphasis on skate and surf culture, Tilly’s (NYSE: TLYS) is a specialty retailer that sells clothing, footwear, and accessories geared towards fashion-forward teens and young adults.
Sales Growth
Examining a company’s long-term performance can provide clues about its quality. Any business can put up a good quarter or two, but many enduring ones grow for years.
With $561.2 million in revenue over the past 12 months, Tilly's is a small retailer, which sometimes brings disadvantages compared to larger competitors benefiting from economies of scale and negotiating leverage with suppliers.
As you can see below, Tilly's struggled to generate demand over the last six years (we compare to 2019 to normalize for COVID-19 impacts). Its sales dropped by 1.2% annually as it didn’t open many new stores and observed lower sales at existing, established locations.
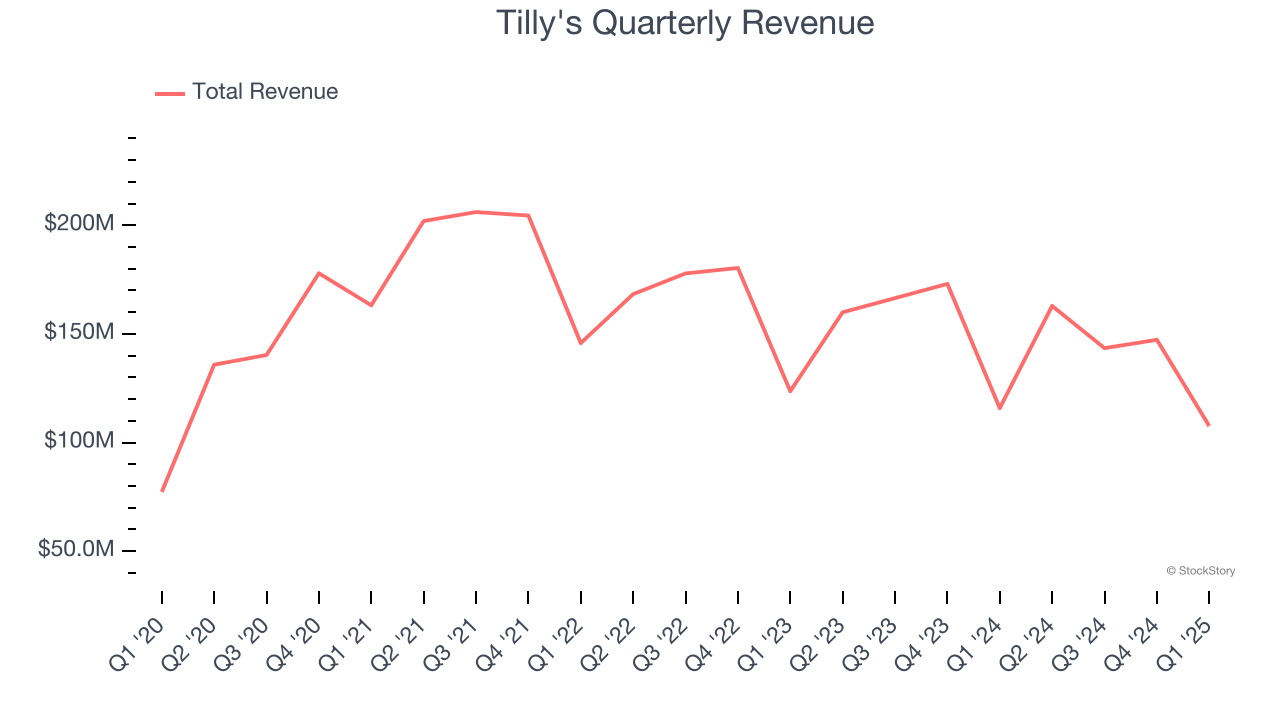
This quarter, Tilly's missed Wall Street’s estimates and reported a rather uninspiring 7.1% year-on-year revenue decline, generating $107.6 million of revenue. Company management is currently guiding for a 5.4% year-on-year decline in sales next quarter.
We also like to judge companies based on their projected revenue growth, but not enough Wall Street analysts cover the company for it to have reliable consensus estimates.
Here at StockStory, we certainly understand the potential of thematic investing. Diverse winners from Microsoft (MSFT) to Alphabet (GOOG), Coca-Cola (KO) to Monster Beverage (MNST) could all have been identified as promising growth stories with a megatrend driving the growth. So, in that spirit, we’ve identified a relatively under-the-radar profitable growth stock benefiting from the rise of AI, available to you FREE via this link.
Store Performance
Number of Stores
A retailer’s store count influences how much it can sell and how quickly revenue can grow.
Tilly's listed 238 locations in the latest quarter and has kept its store count flat over the last two years while other consumer retail businesses have opted for growth.
When a retailer keeps its store footprint steady, it usually means demand is stable and it’s focusing on operational efficiency to increase profitability.
Same-Store Sales
The change in a company's store base only tells one side of the story. The other is the performance of its existing locations and e-commerce sales, which informs management teams whether they should expand or downsize their physical footprints. Same-store sales is an industry measure of whether revenue is growing at those existing stores and is driven by customer visits (often called traffic) and the average spending per customer (ticket).
Tilly’s demand has been shrinking over the last two years as its same-store sales have averaged 7% annual declines. This performance isn’t ideal, and we’d be concerned if Tilly's starts opening new stores to artificially boost revenue growth.
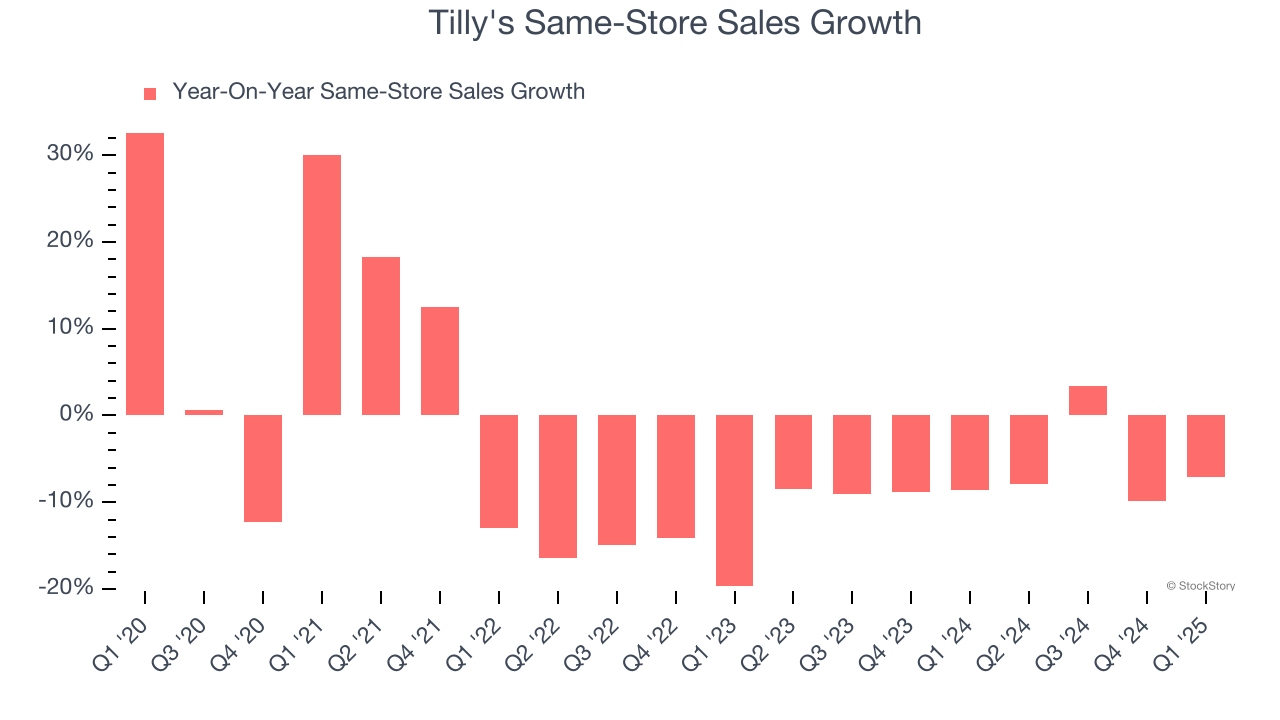
In the latest quarter, Tilly’s same-store sales fell by 7.1% year on year. This performance was more or less in line with its historical levels.
Key Takeaways from Tilly’s Q1 Results
We were impressed by Tilly’s optimistic revenue and EPS guidance for next quarter, which blew past analysts’ expectations. On the other hand, this quarter's revenue, EPS, and EBITDA fell short of Wall Street’s estimates. Zooming out, we think this was a mixed quarter. The stock traded up 12% to $1.49 immediately after reporting.
So do we think Tilly's is an attractive buy at the current price? We think that the latest quarter is only one piece of the longer-term business quality puzzle. Quality, when combined with valuation, can help determine if the stock is a buy. We cover that in our actionable full research report which you can read here, it’s free.