
Women’s plus-size apparel retailer Torrid Holdings (NYSE: CURV) missed Wall Street’s revenue expectations in Q1 CY2025, with sales falling 4.9% year on year to $266 million. Next quarter’s revenue guidance of $257.5 million underwhelmed, coming in 8% below analysts’ estimates. Its GAAP profit of $0.06 per share was $0.02 above analysts’ consensus estimates.
Is now the time to buy Torrid? Find out by accessing our full research report, it’s free.
Torrid (CURV) Q1 CY2025 Highlights:
- Revenue: $266 million vs analyst estimates of $270.2 million (4.9% year-on-year decline, 1.6% miss)
- EPS (GAAP): $0.06 vs analyst estimates of $0.05 ($0.02 beat)
- Adjusted EBITDA: $27.13 million vs analyst estimates of $27.15 million (10.2% margin, in line)
- The company dropped its revenue guidance for the full year to $1.04 billion at the midpoint from $1.09 billion, a 4.4% decrease
- EBITDA guidance for the full year is $100 million at the midpoint, below analyst estimates of $101.6 million
- Operating Margin: 6%, down from 9.3% in the same quarter last year
- Free Cash Flow was -$20.56 million, down from $20.62 million in the same quarter last year
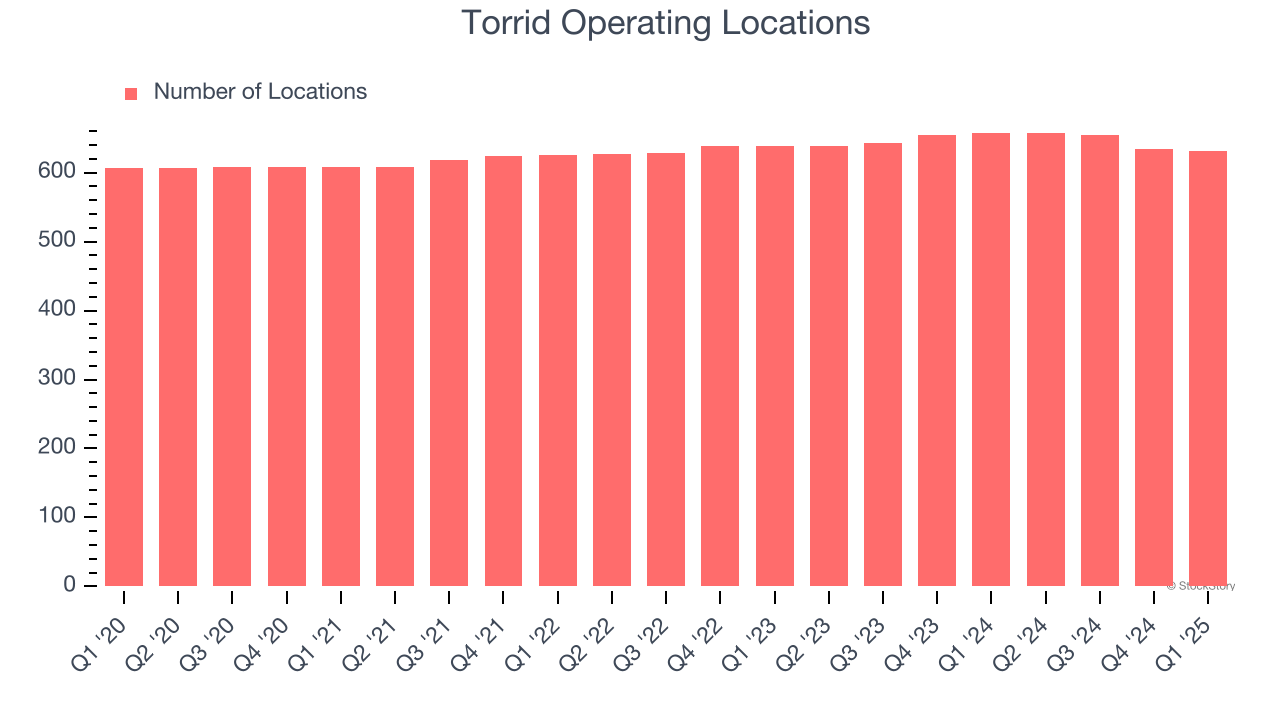
- Locations: 632 at quarter end, down from 658 in the same quarter last year
- Same-Store Sales fell 3.5% year on year (-9% in the same quarter last year)
- Market Capitalization: $531 million
Lisa Harper, Chief Executive Officer, stated, “I’m proud of the strong progress we made this quarter across our strategic initiatives. We delivered first quarter results in line with expectations, with $266 million in net sales and $27.1 million in Adjusted EBITDA(1)—reflecting our continued focus on disciplined execution and profitability.”
Company Overview
Promoting a message of body positivity and inclusiveness, Torrid Holdings (NYSE: CURV) is a plus-size women’s apparel and accessories retailer.
Sales Growth
A company’s long-term performance is an indicator of its overall quality. Any business can have short-term success, but a top-tier one grows for years.
With $1.09 billion in revenue over the past 12 months, Torrid is a small retailer, which sometimes brings disadvantages compared to larger competitors benefiting from economies of scale and negotiating leverage with suppliers.
As you can see below, Torrid grew its sales at a sluggish 1.8% compounded annual growth rate over the last six years (we compare to 2019 to normalize for COVID-19 impacts) as it didn’t open many new stores.
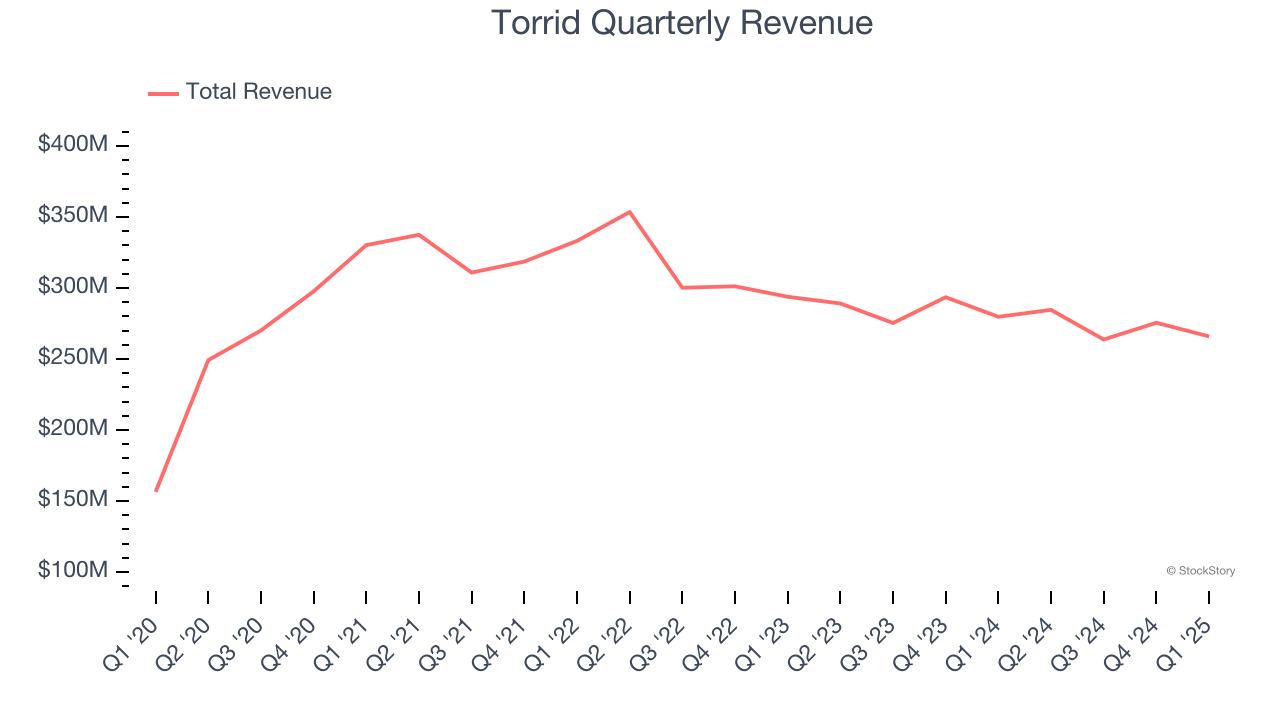
This quarter, Torrid missed Wall Street’s estimates and reported a rather uninspiring 4.9% year-on-year revenue decline, generating $266 million of revenue. Company management is currently guiding for a 9.5% year-on-year decline in sales next quarter.
Looking further ahead, sell-side analysts expect revenue to remain flat over the next 12 months, a slight deceleration versus the last six years. This projection is underwhelming and implies its products will face some demand challenges.
Here at StockStory, we certainly understand the potential of thematic investing. Diverse winners from Microsoft (MSFT) to Alphabet (GOOG), Coca-Cola (KO) to Monster Beverage (MNST) could all have been identified as promising growth stories with a megatrend driving the growth. So, in that spirit, we’ve identified a relatively under-the-radar profitable growth stock benefiting from the rise of AI, available to you FREE via this link.
Store Performance
Number of Stores
The number of stores a retailer operates is a critical driver of how quickly company-level sales can grow.
Torrid operated 632 locations in the latest quarter, and over the last two years, has kept its store count flat while other consumer retail businesses have opted for growth.
When a retailer keeps its store footprint steady, it usually means demand is stable and it’s focusing on operational efficiency to increase profitability.
Same-Store Sales
The change in a company's store base only tells one side of the story. The other is the performance of its existing locations and e-commerce sales, which informs management teams whether they should expand or downsize their physical footprints. Same-store sales is an industry measure of whether revenue is growing at those existing stores and is driven by customer visits (often called traffic) and the average spending per customer (ticket).
Torrid’s demand has been shrinking over the last two years as its same-store sales have averaged 7% annual declines. This performance isn’t ideal, and we’d be concerned if Torrid starts opening new stores to artificially boost revenue growth.
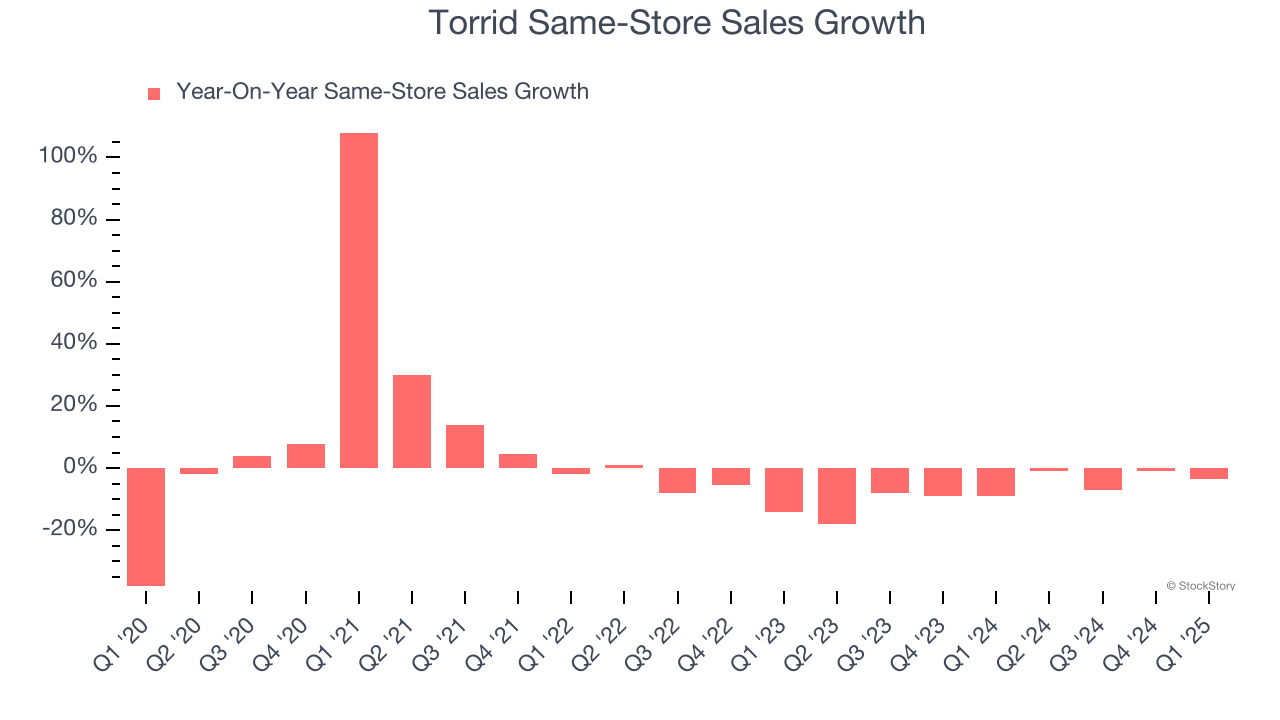
In the latest quarter, Torrid’s same-store sales fell by 3.5% year on year. This decrease was an improvement from its historical levels. It’s always great to see a business’s demand trends improve.
Key Takeaways from Torrid’s Q1 Results
We liked how Torrid beat analysts’ EPS expectations this quarter. On the other hand, its revenue guidance for next quarter missed. Overall, this was a mixed quarter. The stock traded up 4.2% to $5.20 immediately after reporting.
Should you buy the stock or not? If you’re making that decision, you should consider the bigger picture of valuation, business qualities, as well as the latest earnings. We cover that in our actionable full research report which you can read here, it’s free.
