
Over the past six months, Amkor’s stock price fell to $20.82. Shareholders have lost 19.9% of their capital, which is disappointing considering the S&P 500 has climbed by 5.7%. This may have investors wondering how to approach the situation.
Is there a buying opportunity in Amkor, or does it present a risk to your portfolio? Get the full stock story straight from our expert analysts, it’s free.
Why Do We Think Amkor Will Underperform?
Despite the more favorable entry price, we're sitting this one out for now. Here are three reasons why AMKR doesn't excite us and a stock we'd rather own.
1. Revenue Tumbling Downwards
We at StockStory place the most emphasis on long-term growth, but within semiconductors, a stretched historical view may miss new demand cycles or industry trends like AI. Amkor’s recent performance marks a sharp pivot from its five-year trend as its revenue has shown annualized declines of 5.1% over the last two years. 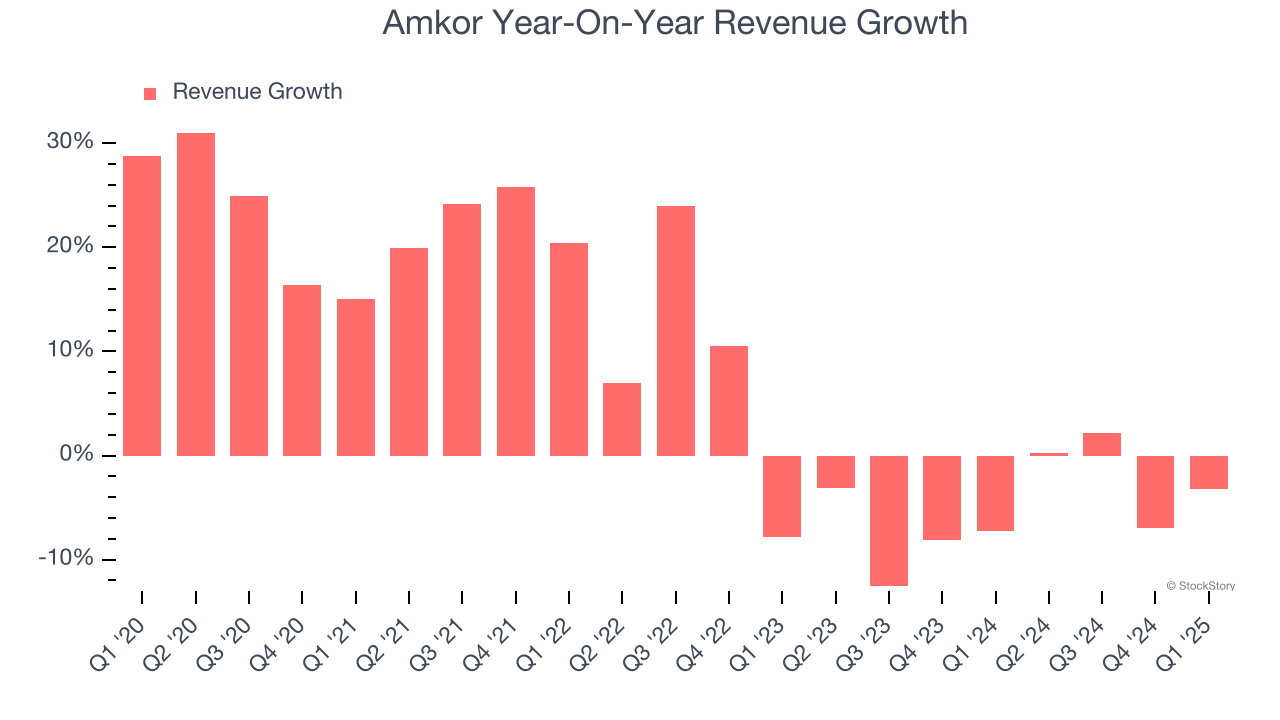
2. Low Gross Margin Reveals Weak Structural Profitability
Gross profit margin is a key metric to track because it shows how much money a semiconductor company gets to keep after paying for its raw materials, manufacturing, and other input costs.
Amkor’s gross margin is one of the worst in the semiconductor industry, signaling it operates in a competitive market and lacks pricing power. As you can see below, it averaged a 14.5% gross margin over the last two years. Said differently, Amkor had to pay a chunky $85.48 to its suppliers for every $100 in revenue. 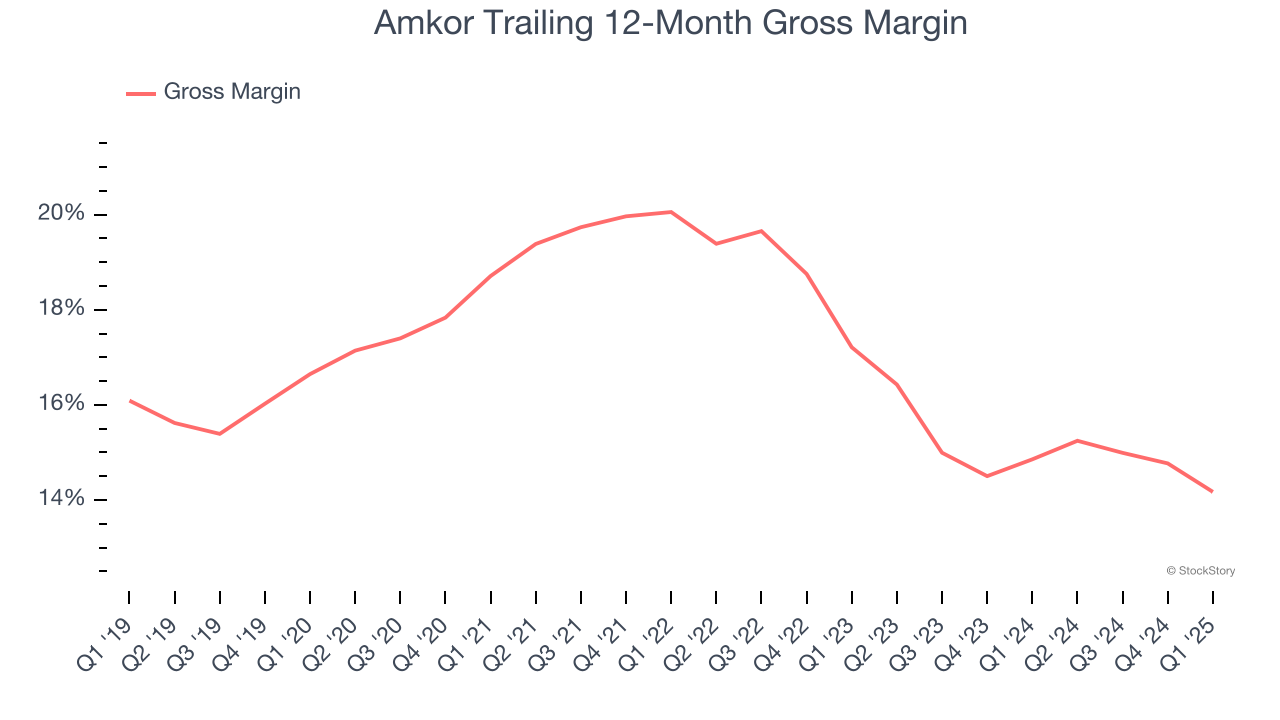
3. Weak Operating Margin Could Cause Trouble
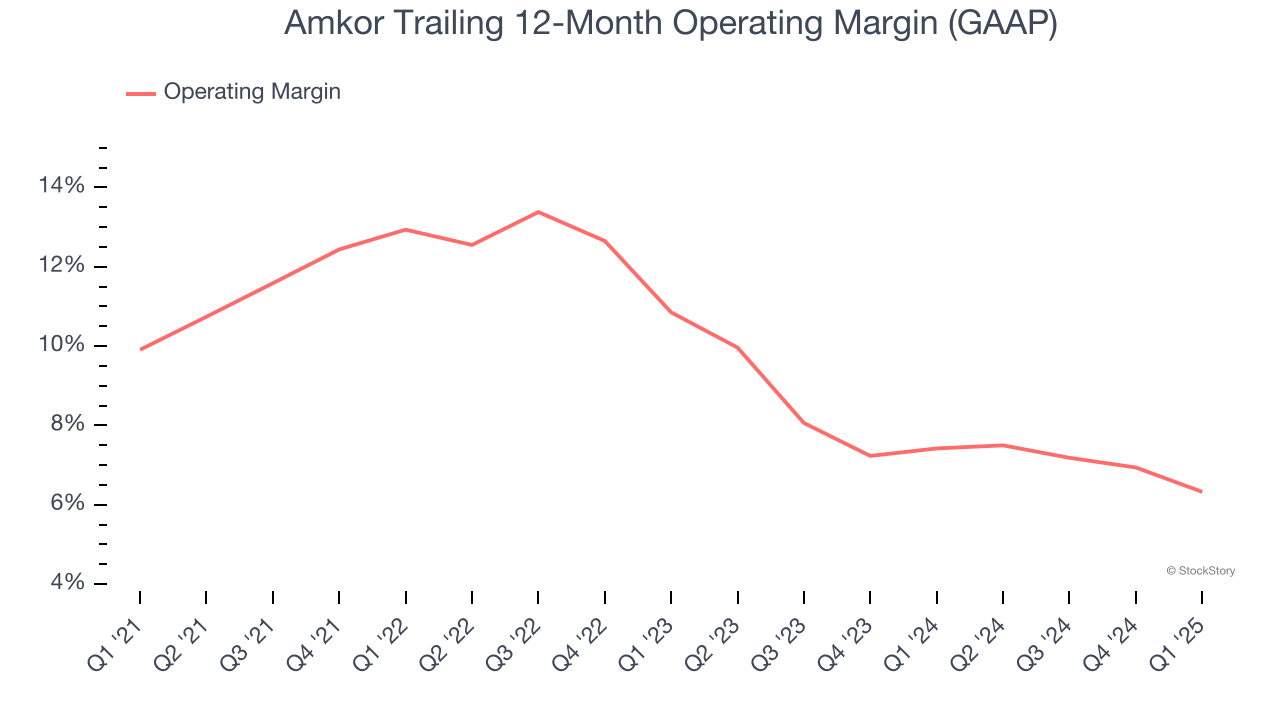
Operating margin is a key measure of profitability. Think of it as net income - the bottom line - excluding the impact of taxes and interest on debt, which are less connected to business fundamentals.
Amkor was profitable over the last two years but held back by its large cost base. Its average operating margin of 6.9% was weak for a semiconductor business. This result isn’t too surprising given its low gross margin as a starting point.
Final Judgment
Amkor falls short of our quality standards. Following the recent decline, the stock trades at 12.3× forward P/E (or $20.82 per share). While this valuation is fair, the upside isn’t great compared to the potential downside. There are superior stocks to buy right now. We’d suggest looking at a top digital advertising platform riding the creator economy.
High-Quality Stocks for All Market Conditions
The market surged in 2024 and reached record highs after Donald Trump’s presidential victory in November, but questions about new economic policies are adding much uncertainty for 2025.
While the crowd speculates what might happen next, we’re homing in on the companies that can succeed regardless of the political or macroeconomic environment. Put yourself in the driver’s seat and build a durable portfolio by checking out our Top 5 Growth Stocks for this month. This is a curated list of our High Quality stocks that have generated a market-beating return of 183% over the last five years (as of March 31st 2025).
Stocks that made our list in 2020 include now familiar names such as Nvidia (+1,545% between March 2020 and March 2025) as well as under-the-radar businesses like the once-micro-cap company Tecnoglass (+1,754% five-year return). Find your next big winner with StockStory today.