
Over the last six months, Benchmark’s shares have sunk to $38.83, producing a disappointing 14.3% loss - a stark contrast to the S&P 500’s 5.7% gain. This was partly driven by its softer quarterly results and may have investors wondering how to approach the situation.
Is there a buying opportunity in Benchmark, or does it present a risk to your portfolio? See what our analysts have to say in our full research report, it’s free.
Why Is Benchmark Not Exciting?
Despite the more favorable entry price, we're sitting this one out for now. Here are three reasons why there are better opportunities than BHE and a stock we'd rather own.
1. Long-Term Revenue Growth Disappoints
Examining a company’s long-term performance can provide clues about its quality. Any business can have short-term success, but a top-tier one grows for years. Regrettably, Benchmark’s sales grew at a tepid 3.7% compounded annual growth rate over the last five years. This fell short of our benchmark for the business services sector. 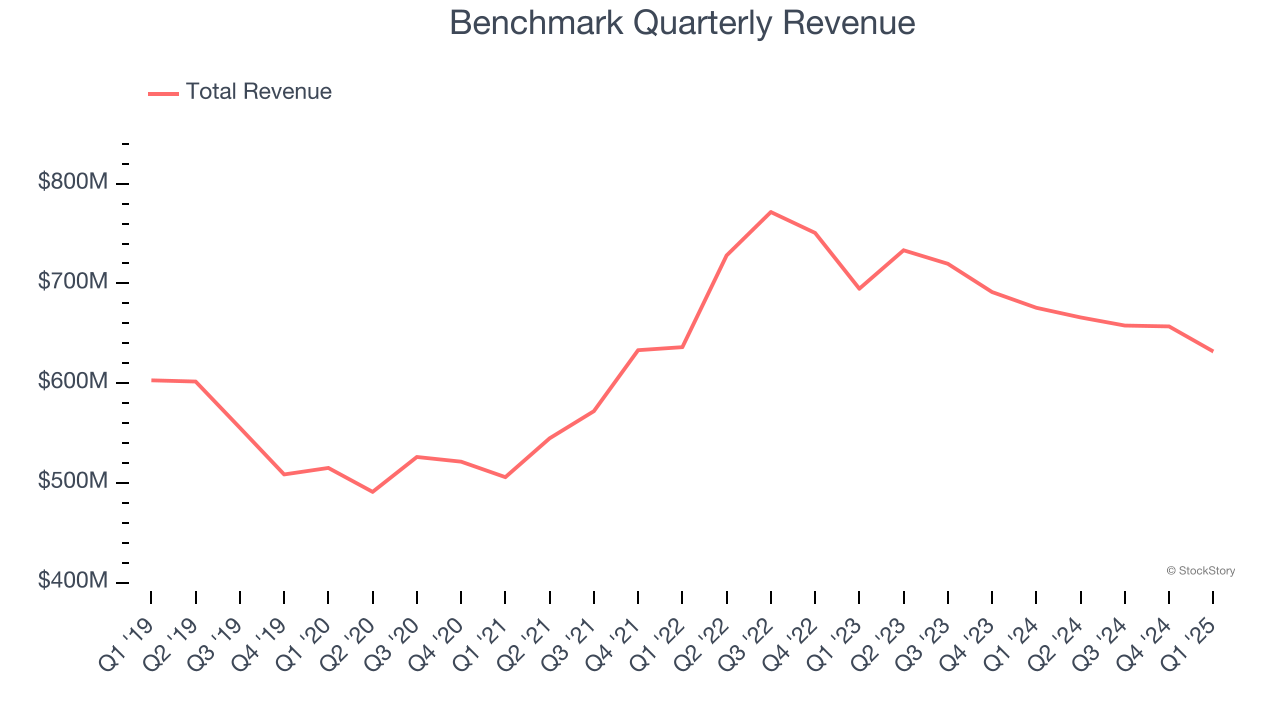
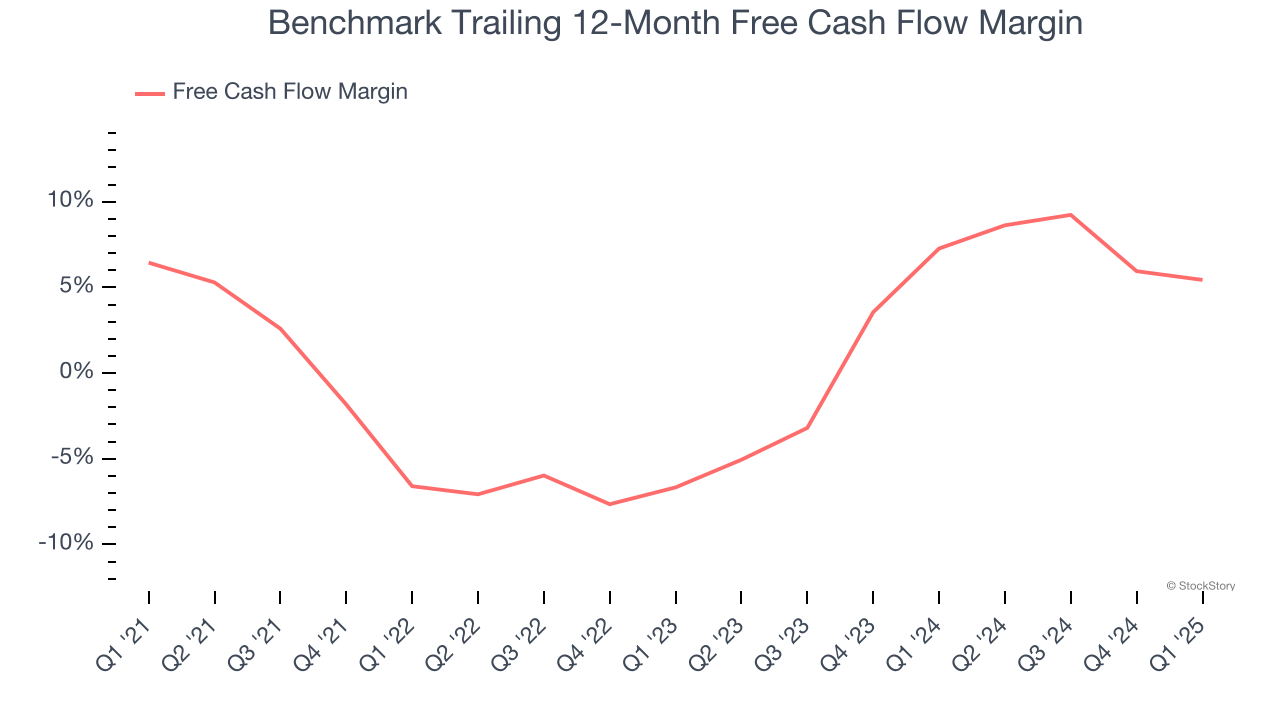
2. Breakeven Free Cash Flow Limits Reinvestment Potential
Free cash flow isn't a prominently featured metric in company financials and earnings releases, but we think it's telling because it accounts for all operating and capital expenses, making it tough to manipulate. Cash is king.
Benchmark broke even from a free cash flow perspective over the last five years, giving the company limited opportunities to return capital to shareholders.
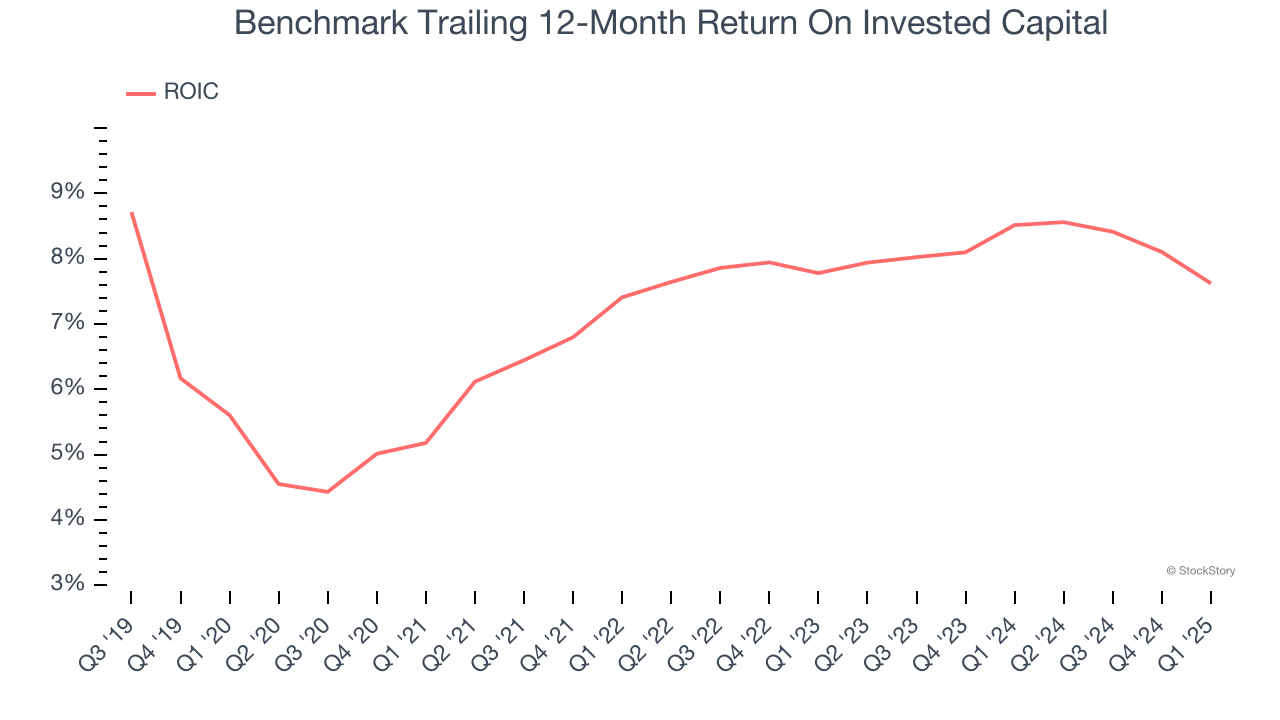
3. Previous Growth Initiatives Haven’t Impressed
Growth gives us insight into a company’s long-term potential, but how capital-efficient was that growth? Enter ROIC, a metric showing how much operating profit a company generates relative to the money it has raised (debt and equity).
Benchmark historically did a mediocre job investing in profitable growth initiatives. Its five-year average ROIC was 7.3%, somewhat low compared to the best business services companies that consistently pump out 25%+.
Final Judgment
Benchmark isn’t a terrible business, but it isn’t one of our picks. After the recent drawdown, the stock trades at 15× forward P/E (or $38.83 per share). Investors with a higher risk tolerance might like the company, but we don’t really see a big opportunity at the moment. We're pretty confident there are more exciting stocks to buy at the moment. Let us point you toward one of our top software and edge computing picks.
Stocks We Like More Than Benchmark
Donald Trump’s victory in the 2024 U.S. Presidential Election sent major indices to all-time highs, but stocks have retraced as investors debate the health of the economy and the potential impact of tariffs.
While this leaves much uncertainty around 2025, a few companies are poised for long-term gains regardless of the political or macroeconomic climate, like our Top 5 Growth Stocks for this month. This is a curated list of our High Quality stocks that have generated a market-beating return of 183% over the last five years (as of March 31st 2025).
Stocks that made our list in 2020 include now familiar names such as Nvidia (+1,545% between March 2020 and March 2025) as well as under-the-radar businesses like the once-small-cap company Exlservice (+354% five-year return). Find your next big winner with StockStory today.