Global airline Delta Air Lines (NYSE: DAL) reported revenue ahead of Wall Street’s expectations in Q2 CY2025, but sales were flat year on year at $16.65 billion. Guidance for next quarter’s revenue was better than expected at $15.99 billion at the midpoint, 1.9% above analysts’ estimates. Its GAAP profit of $3.27 per share was 57.2% above analysts’ consensus estimates.
Is now the time to buy Delta? Find out by accessing our full research report, it’s free.
Delta (DAL) Q2 CY2025 Highlights:
- Revenue: $16.65 billion vs analyst estimates of $16.41 billion (flat year on year, 1.5% beat)
- EPS (GAAP): $3.27 vs analyst estimates of $2.08 (57.2% beat)
- Adjusted EBITDA: $2.70 billion vs analyst estimates of $2.72 billion (16.2% margin, 0.7% miss)
- Revenue Guidance for Q3 CY2025 is $15.99 billion at the midpoint, above analyst estimates of $15.69 billion
- EPS (GAAP) guidance for the full year is $5.75 at the midpoint, beating analyst estimates by 3.8%
- Operating Margin: 12.6%, in line with the same quarter last year
- Free Cash Flow Margin: 3.9%, down from 6.9% in the same quarter last year
- Revenue Passenger Miles: 66.42 billion, up 1.18 billion year on year
- Market Capitalization: $33.1 billion
"In the June quarter, Delta delivered record revenue on a 13 percent operating margin, generating $1.8 billion in pre-tax profit and leading network peers across key operational metrics. This strong performance is a direct reflection of the outstanding contributions of our people, who continue to set the bar for industry performance," said Ed Bastian, Delta's CEO.
Company Overview
One of the ‘Big Four’ airlines in the US, Delta Air Lines (NYSE: DAL) is a major global air carrier that serves both business and leisure travelers through its domestic and international flights.
Revenue Growth
Examining a company’s long-term performance can provide clues about its quality. Even a bad business can shine for one or two quarters, but a top-tier one grows for years. Over the last five years, Delta grew its sales at an incredible 35.6% compounded annual growth rate. Its growth beat the average consumer discretionary company and shows its offerings resonate with customers.
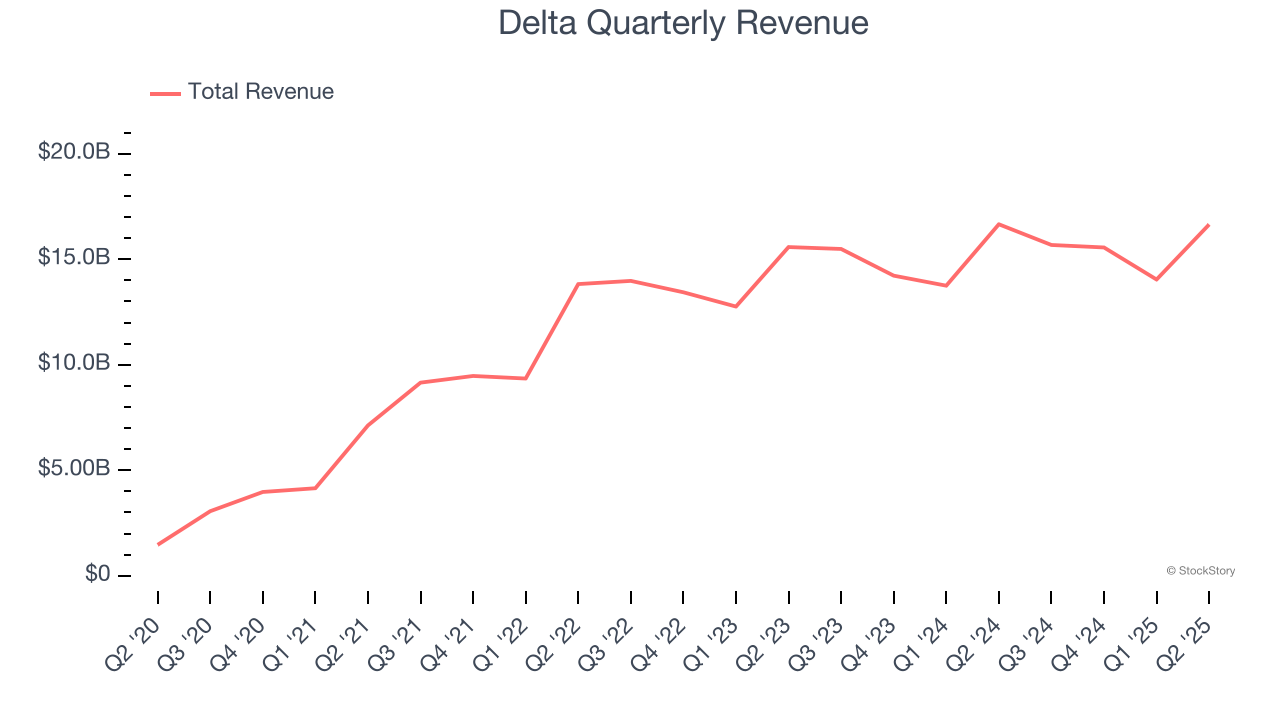
We at StockStory place the most emphasis on long-term growth, but within consumer discretionary, a stretched historical view may miss a company riding a successful new property or trend. Delta’s recent performance shows its demand has slowed significantly as its annualized revenue growth of 5.4% over the last two years was well below its five-year trend. 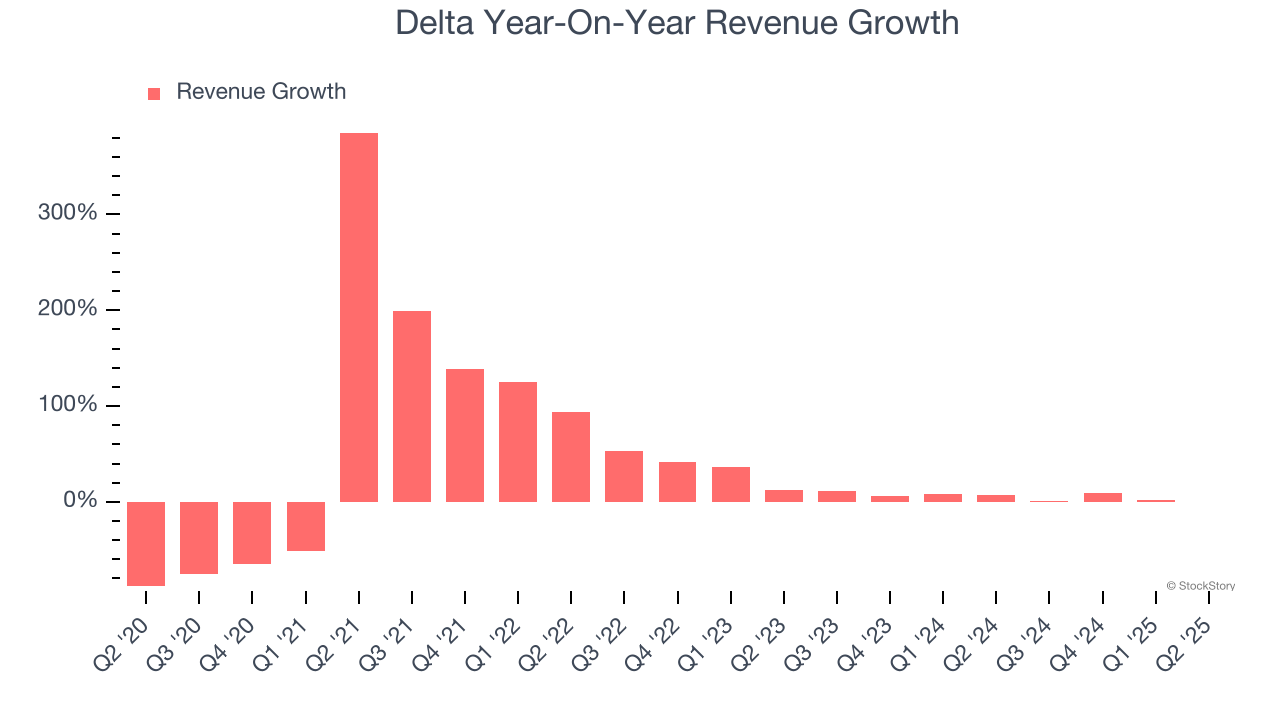
We can better understand the company’s revenue dynamics by analyzing its number of revenue passenger miles, which reached 66.42 billion in the latest quarter. Over the last two years, Delta’s revenue passenger miles averaged 7.5% year-on-year growth. Because this number is higher than its revenue growth during the same period, we can see the company’s monetization has fallen. 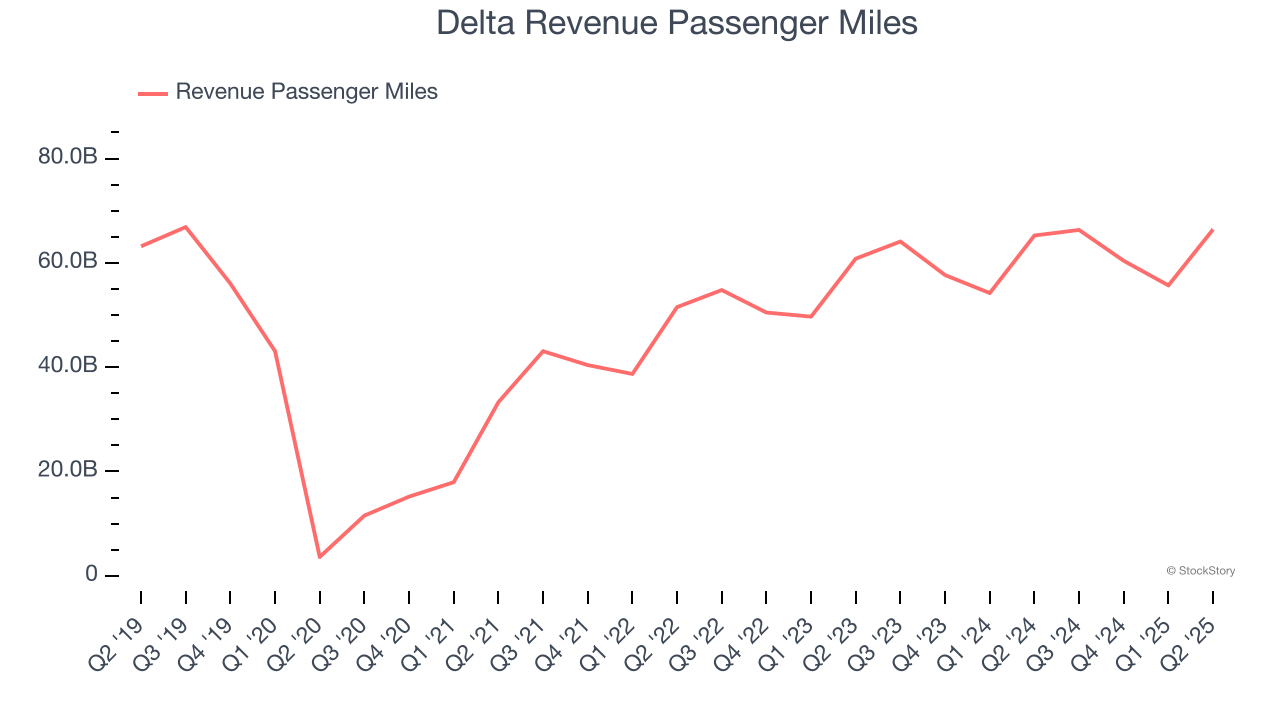
This quarter, Delta’s $16.65 billion of revenue was flat year on year but beat Wall Street’s estimates by 1.5%. Company management is currently guiding for a 2% year-on-year increase in sales next quarter.
Looking further ahead, sell-side analysts expect revenue to remain flat over the next 12 months, a deceleration versus the last two years. This projection doesn't excite us and implies its products and services will face some demand challenges.
Here at StockStory, we certainly understand the potential of thematic investing. Diverse winners from Microsoft (MSFT) to Alphabet (GOOG), Coca-Cola (KO) to Monster Beverage (MNST) could all have been identified as promising growth stories with a megatrend driving the growth. So, in that spirit, we’ve identified a relatively under-the-radar profitable growth stock benefiting from the rise of AI, available to you FREE via this link.
Operating Margin
Delta’s operating margin might fluctuated slightly over the last 12 months but has generally stayed the same, averaging 9.8% over the last two years. This profitability was mediocre for a consumer discretionary business and caused by its suboptimal cost structure.
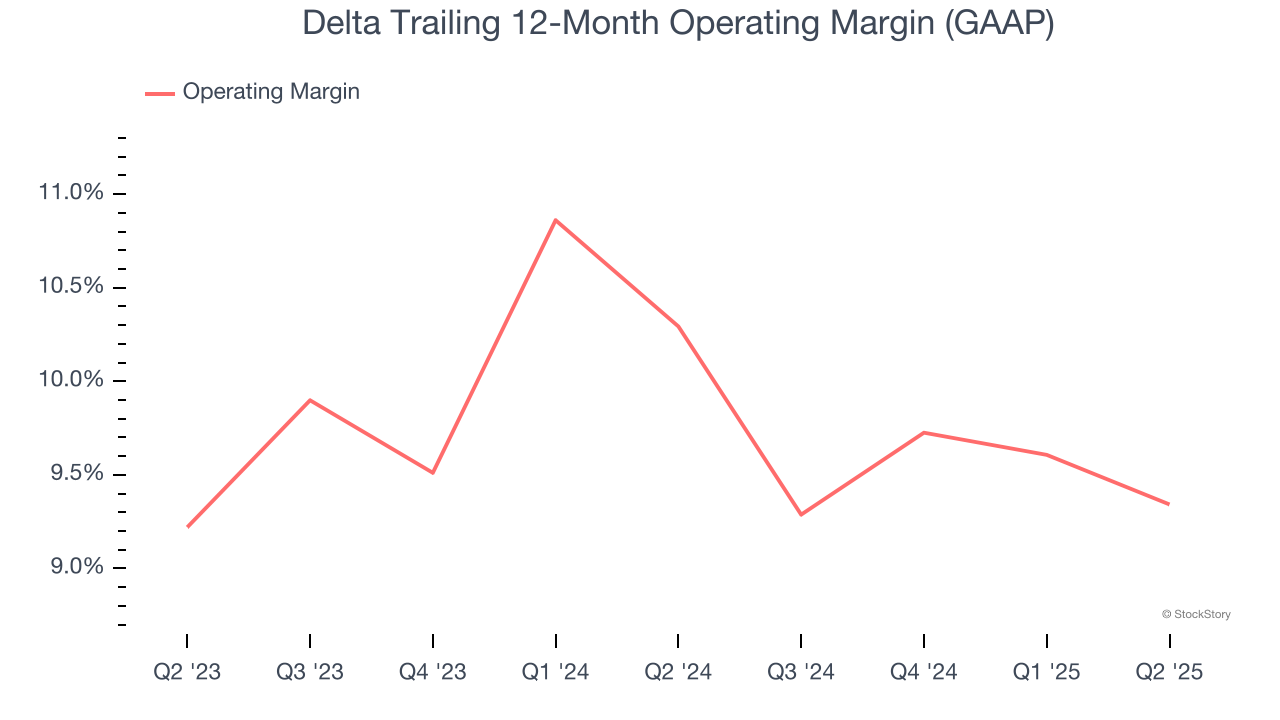
In Q2, Delta generated an operating margin profit margin of 12.6%, in line with the same quarter last year. This indicates the company’s overall cost structure has been relatively stable.
In the coming year, Wall Street expects Delta to maintain its trailing 12-month operating margin of 9.3%.
Earnings Per Share
Revenue trends explain a company’s historical growth, but the long-term change in earnings per share (EPS) points to the profitability of that growth – for example, a company could inflate its sales through excessive spending on advertising and promotions.
Delta’s full-year EPS flipped from negative to positive over the last five years. This is encouraging and shows it’s at a critical moment in its life.
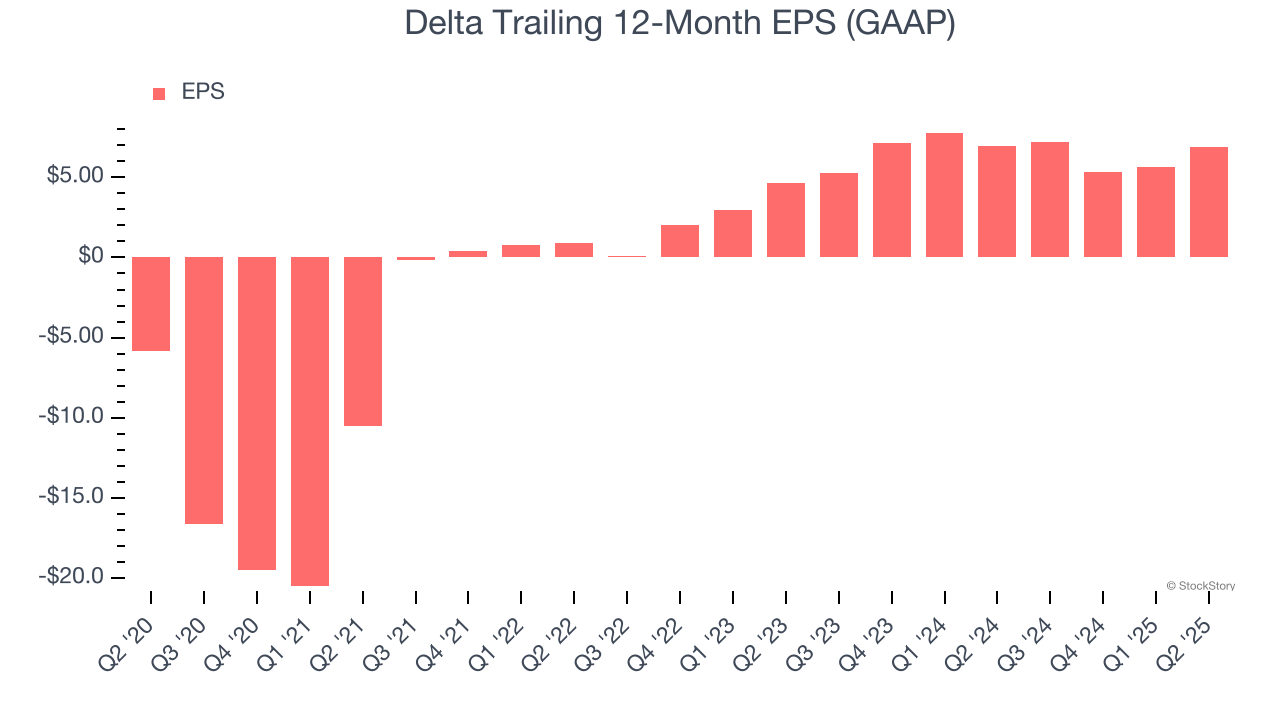
In Q2, Delta reported EPS at $3.27, up from $2.01 in the same quarter last year. This print easily cleared analysts’ estimates, and shareholders should be content with the results. Over the next 12 months, Wall Street expects Delta’s full-year EPS of $6.90 to shrink by 12.8%.
Key Takeaways from Delta’s Q2 Results
We were impressed by Delta’s optimistic revenue and EPS guidance for next quarter, which blew past analysts’ expectations. We were also excited this quarter's revenue and EPS outperformed Wall Street’s estimates. On the other hand, its number of revenue passenger miles missed. Still, we think this was a solid quarter with a strong outlook. The stock traded up 8.9% to $55.15 immediately after reporting.
Sure, Delta had a solid quarter, but if we look at the bigger picture, is this stock a buy? When making that decision, it’s important to consider its valuation, business qualities, as well as what has happened in the latest quarter. We cover that in our actionable full research report which you can read here, it’s free.