Since January 2025, Thermon has been in a holding pattern, posting a small loss of 1.5% while floating around $28.18. The stock also fell short of the S&P 500’s 7.1% gain during that period.
Given the weaker price action, is now a good time to buy THR? Or should investors expect a bumpy road ahead? Find out in our full research report, it’s free.
Why Does THR Stock Spark Debate?
Creating the first packaged tracing systems, Thermon (NYSE: THR) is a leading provider of engineered industrial process heating solutions for process industries.
Two Things to Like:
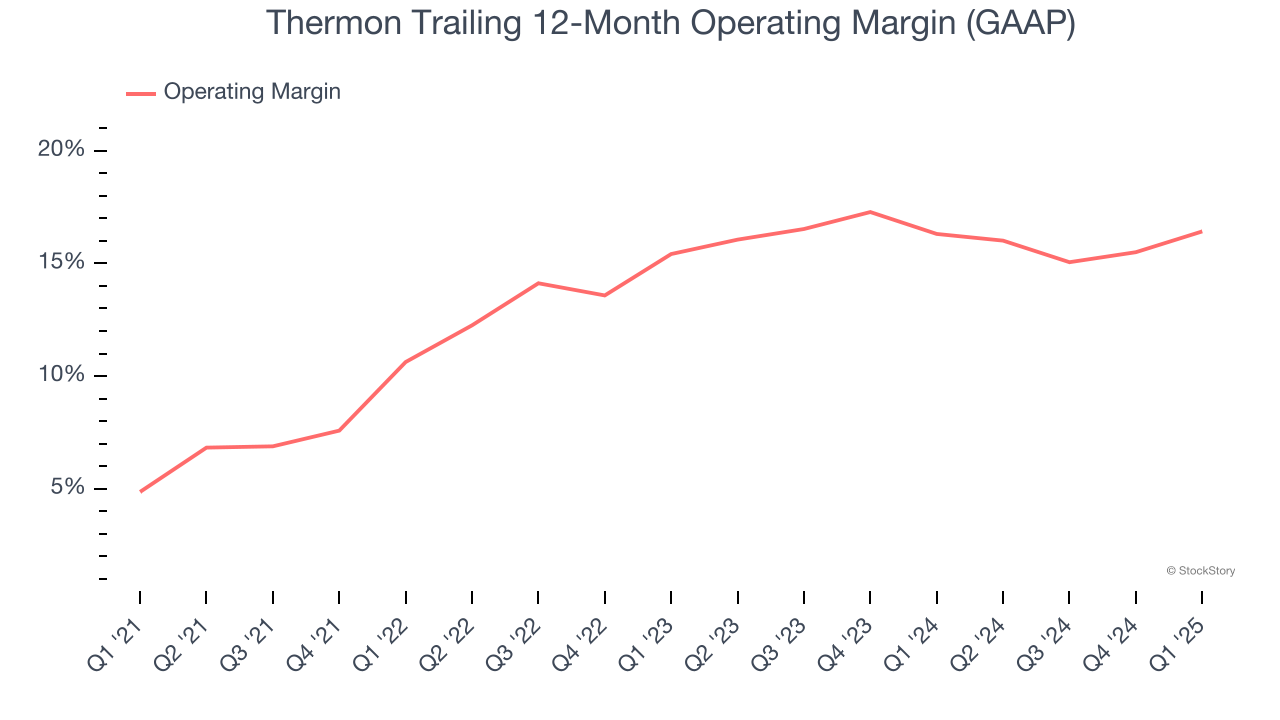
1. Operating Margin Rising, Profits Up
Operating margin is one of the best measures of profitability because it tells us how much money a company takes home after procuring and manufacturing its products, marketing and selling those products, and most importantly, keeping them relevant through research and development.
Looking at the trend in its profitability, Thermon’s operating margin rose by 11.6 percentage points over the last five years, as its sales growth gave it operating leverage. Its operating margin for the trailing 12 months was 16.4%.
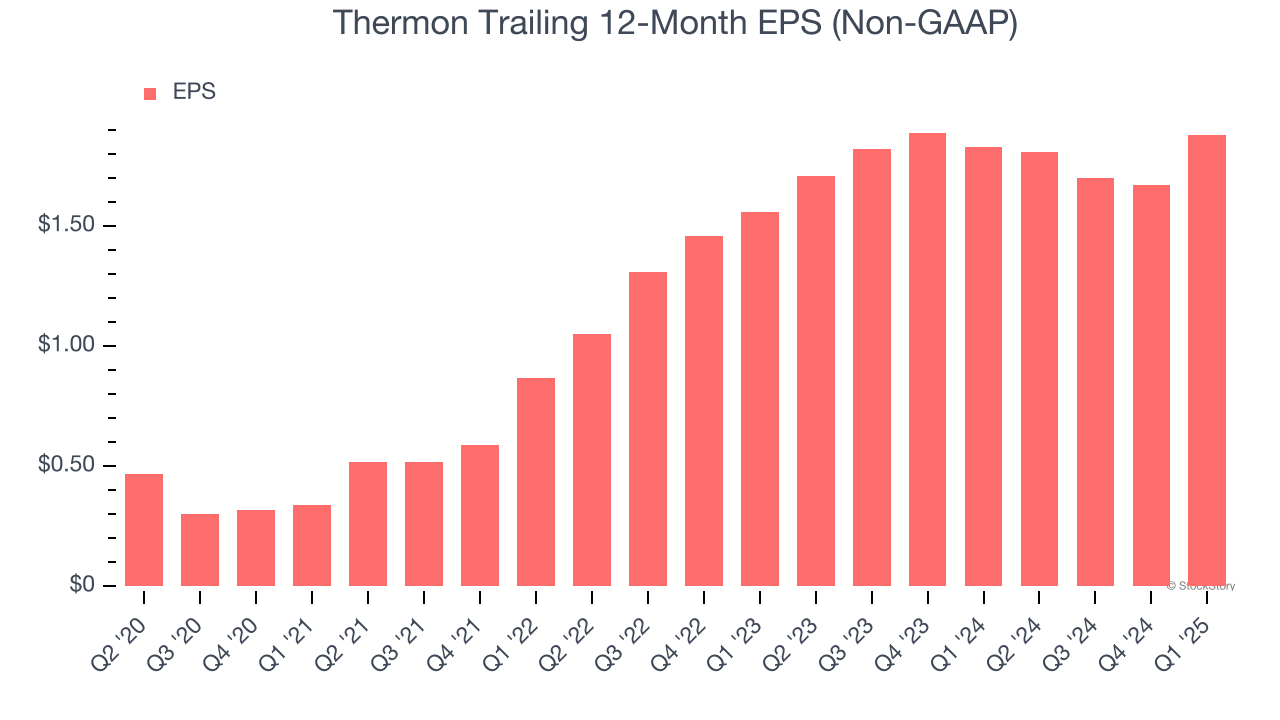
2. Outstanding Long-Term EPS Growth
Analyzing the long-term change in earnings per share (EPS) shows whether a company's incremental sales were profitable – for example, revenue could be inflated through excessive spending on advertising and promotions.
Thermon’s EPS grew at an astounding 20.9% compounded annual growth rate over the last five years, higher than its 5.4% annualized revenue growth. This tells us the company became more profitable on a per-share basis as it expanded.
One Reason to be Careful:
Long-Term Revenue Growth Disappoints
Examining a company’s long-term performance can provide clues about its quality. Even a bad business can shine for one or two quarters, but a top-tier one grows for years. Regrettably, Thermon’s sales grew at a tepid 5.4% compounded annual growth rate over the last five years. This wasn’t a great result compared to the rest of the industrials sector, but there are still things to like about Thermon. 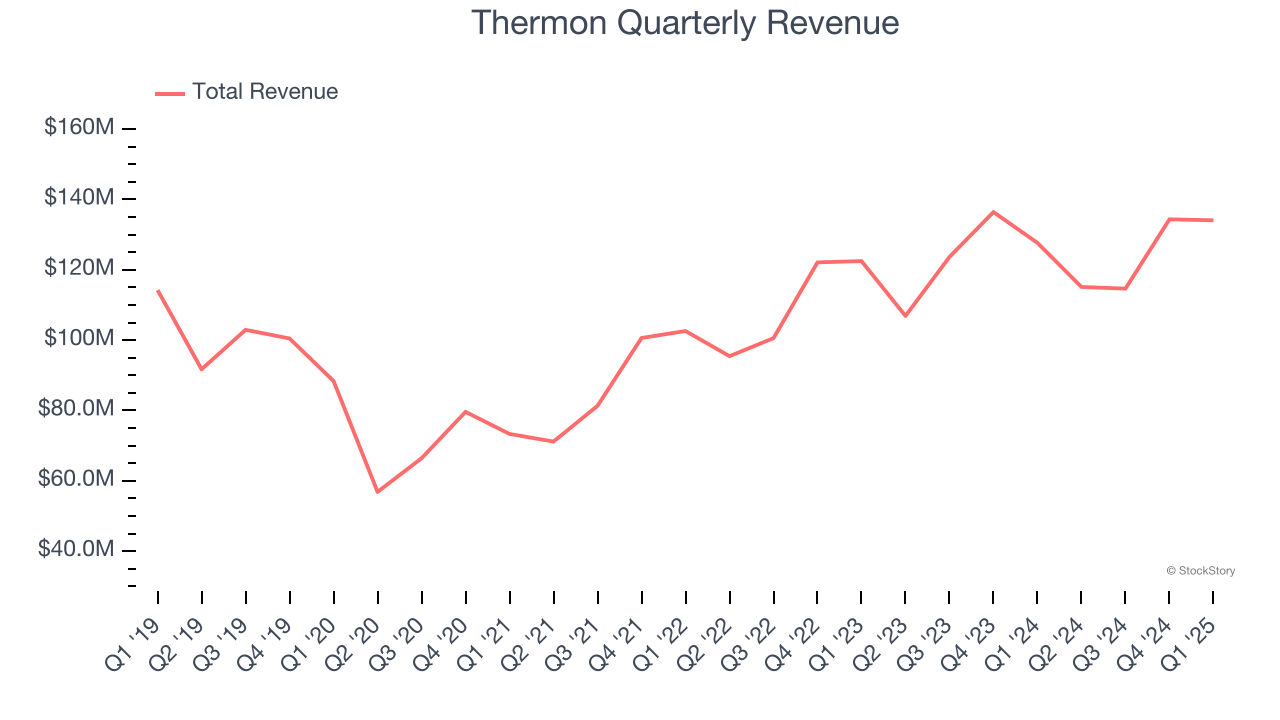
Final Judgment
Thermon has huge potential even though it has some open questions. With its shares trailing the market in recent months, the stock trades at 13.8× forward P/E (or $28.18 per share). Is now the right time to buy? See for yourself in our in-depth research report, it’s free.
Stocks We Like Even More Than Thermon
Market indices reached historic highs following Donald Trump’s presidential victory in November 2024, but the outlook for 2025 is clouded by new trade policies that could impact business confidence and growth.
While this has caused many investors to adopt a "fearful" wait-and-see approach, we’re leaning into our best ideas that can grow regardless of the political or macroeconomic climate. Take advantage of Mr. Market by checking out our Top 9 Market-Beating Stocks. This is a curated list of our High Quality stocks that have generated a market-beating return of 183% over the last five years (as of March 31st 2025).
Stocks that made our list in 2020 include now familiar names such as Nvidia (+1,545% between March 2020 and March 2025) as well as under-the-radar businesses like the once-small-cap company Exlservice (+354% five-year return). Find your next big winner with StockStory today.
StockStory is growing and hiring equity analyst and marketing roles. Are you a 0 to 1 builder passionate about the markets and AI? See the open roles here.