
Preferred Bank trades at $91.43 per share and has stayed right on track with the overall market, gaining 7.6% over the last six months. At the same time, the S&P 500 has returned 7.1%.
Is now the time to buy PFBC? Find out in our full research report, it’s free.
Why Does PFBC Stock Spark Debate?
Founded in 1991 with a focus on serving the Pacific Rim community in Southern California, Preferred Bank (NASDAQ: PFBC) is a commercial bank that provides banking products and services to small and mid-sized businesses, entrepreneurs, real estate developers, and high net worth individuals.
Two Things to Like:
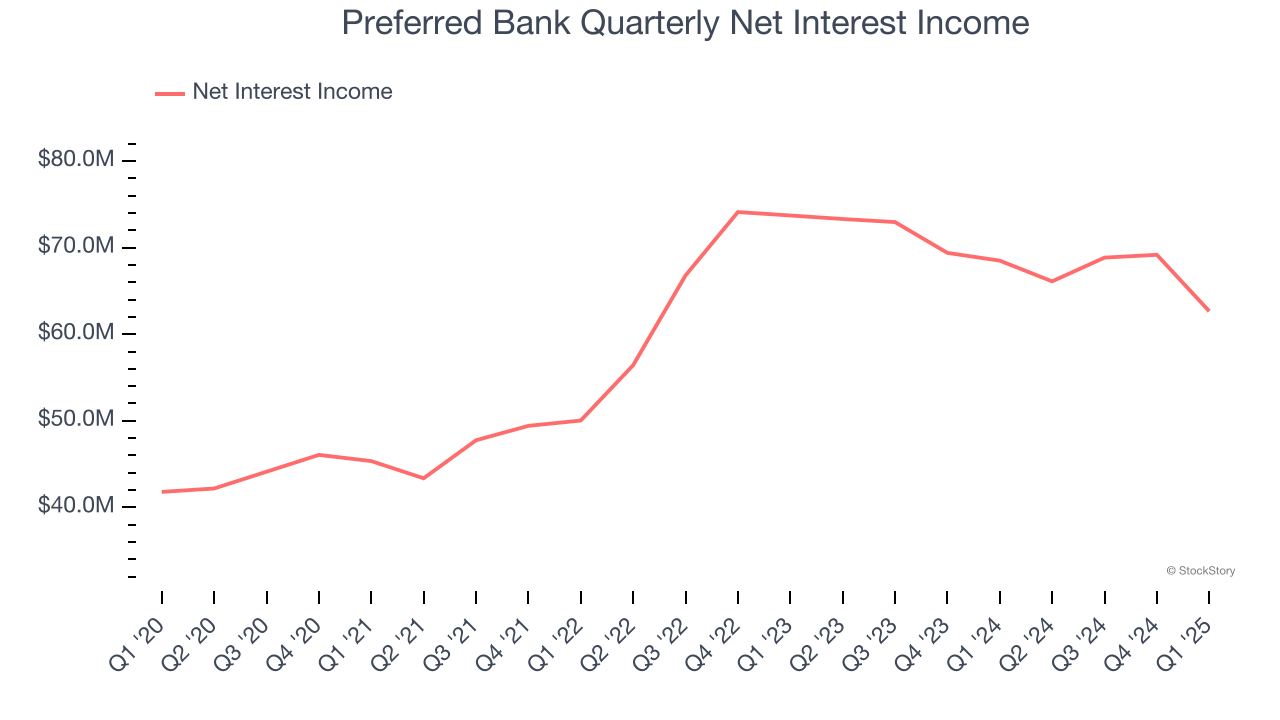
1. Net Interest Income Drives Additional Growth Opportunities
Markets consistently prioritize net interest income growth over fee-based revenue, recognizing its superior quality and recurring nature compared to the more unpredictable non-interest income streams.
Preferred Bank’s net interest income has grown at a 10.7% annualized rate over the last four years, a step above the broader bank industry.
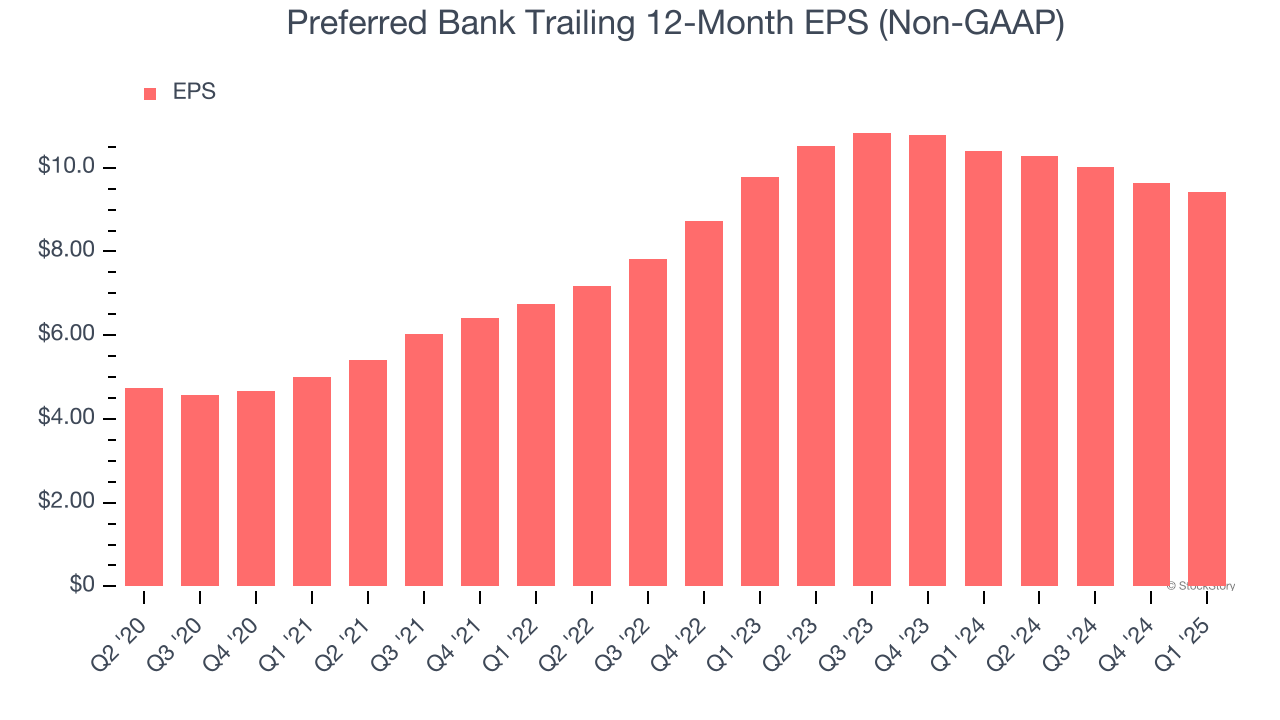
2. Outstanding Long-Term EPS Growth
Analyzing the long-term change in earnings per share (EPS) shows whether a company's incremental sales were profitable – for example, revenue could be inflated through excessive spending on advertising and promotions.
Preferred Bank’s EPS grew at an astounding 13.3% compounded annual growth rate over the last five years, higher than its 10.2% annualized revenue growth. This tells us the company became more profitable on a per-share basis as it expanded.
One Reason to be Careful:
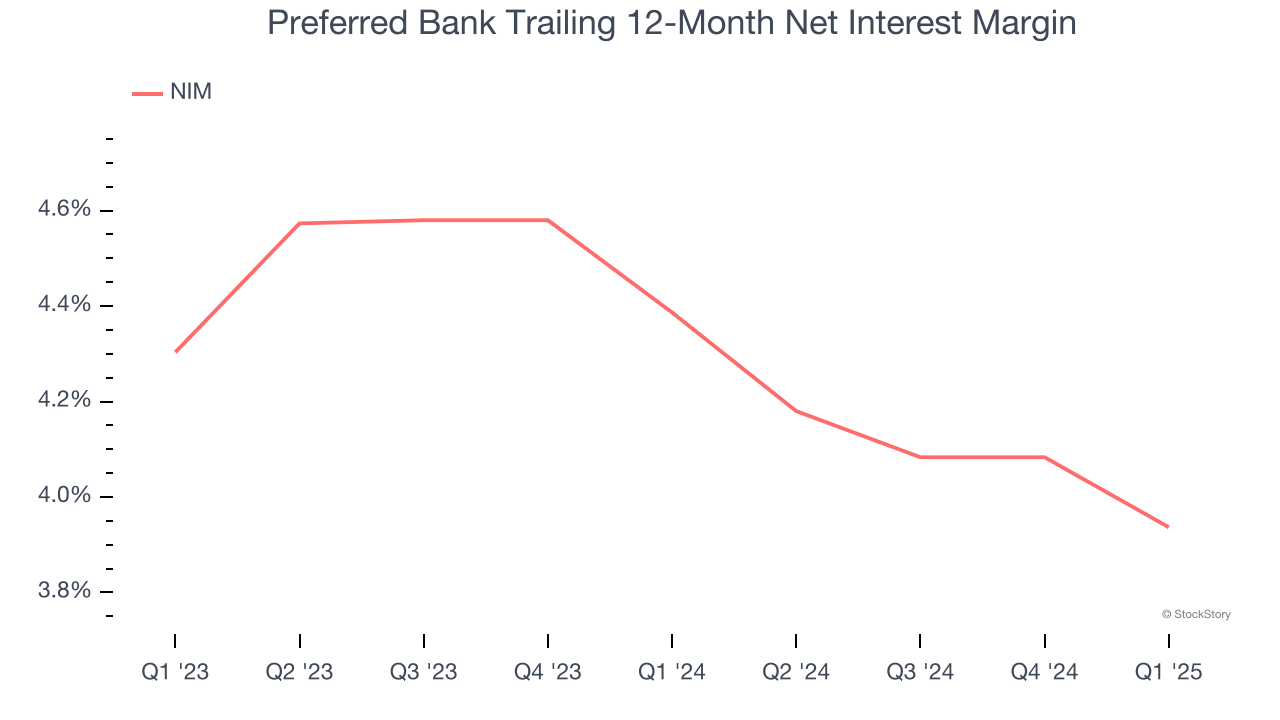
Net Interest Margin Dropping
Net interest margin represents how much a bank earns in relation to its outstanding loans. It’s one of the most important metrics to track because it shows how a bank’s loans are performing and whether it has the ability to command higher premiums for its services.
Over the past two years, Preferred Bank’s net interest margin averaged 4.2%. However, its margin contracted by 36.7 basis points (100 basis points = 1 percentage point) over that period.
This decline was a headwind for its net interest income. While prevailing rates are a major determinant of net interest margin changes over time, the decline could mean Preferred Bank either faced competition for loans and deposits or experienced a negative mix shift in its balance sheet composition. One caveat is that net interest margins can also decrease to reflect lower default risk if banks begin making more conservative loans.
Final Judgment
Preferred Bank’s merits more than compensate for its flaws, but at $91.43 per share (or 1.4× forward P/B), is now the time to initiate a position? See for yourself in our full research report, it’s free.
Stocks We Like Even More Than Preferred Bank
Donald Trump’s victory in the 2024 U.S. Presidential Election sent major indices to all-time highs, but stocks have retraced as investors debate the health of the economy and the potential impact of tariffs.
While this leaves much uncertainty around 2025, a few companies are poised for long-term gains regardless of the political or macroeconomic climate, like our Top 5 Strong Momentum Stocks for this week. This is a curated list of our High Quality stocks that have generated a market-beating return of 183% over the last five years (as of March 31st 2025).
Stocks that made our list in 2020 include now familiar names such as Nvidia (+1,545% between March 2020 and March 2025) as well as under-the-radar businesses like the once-micro-cap company Tecnoglass (+1,754% five-year return). Find your next big winner with StockStory today.
StockStory is growing and hiring equity analyst and marketing roles. Are you a 0 to 1 builder passionate about the markets and AI? See the open roles here.