
Regional banking company First Horizon (NYSE: FHN) met Wall Street’s revenue expectations in Q2 CY2025, with sales up 1.8% year on year to $830 million. Its non-GAAP profit of $0.45 per share was 8.2% above analysts’ consensus estimates.
Is now the time to buy First Horizon? Find out by accessing our full research report, it’s free.
First Horizon (FHN) Q2 CY2025 Highlights:
- Net Interest Income: $641 million vs analyst estimates of $642.8 million (1.9% year-on-year growth, in line)
- Net Interest Margin: 3.4% vs analyst estimates of 3.4% (2 basis point year-on-year increase, in line)
- Revenue: $830 million vs analyst estimates of $827.7 million (1.8% year-on-year growth, in line)
- Efficiency Ratio: 59.2% vs analyst estimates of 60.5% (1.3 percentage point beat)
- Adjusted EPS: $0.45 vs analyst estimates of $0.42 (8.2% beat)
- Market Capitalization: $10.76 billion
Company Overview
Tracing its roots back to 1864 during the Civil War era, First Horizon (NYSE: FHN) is a Tennessee-based bank holding company that provides commercial and consumer banking, wealth management, and specialty financial services across multiple states.
Sales Growth
In general, banks make money from two primary sources. The first is net interest income, which is interest earned on loans, mortgages, and investments in securities minus interest paid out on deposits. The second source is non-interest income, which can come from bank account, credit card, wealth management, investing banking, and trading fees.
Luckily, First Horizon’s revenue grew at an impressive 10.4% compounded annual growth rate over the last five years. Its growth beat the average bank company and shows its offerings resonate with customers.
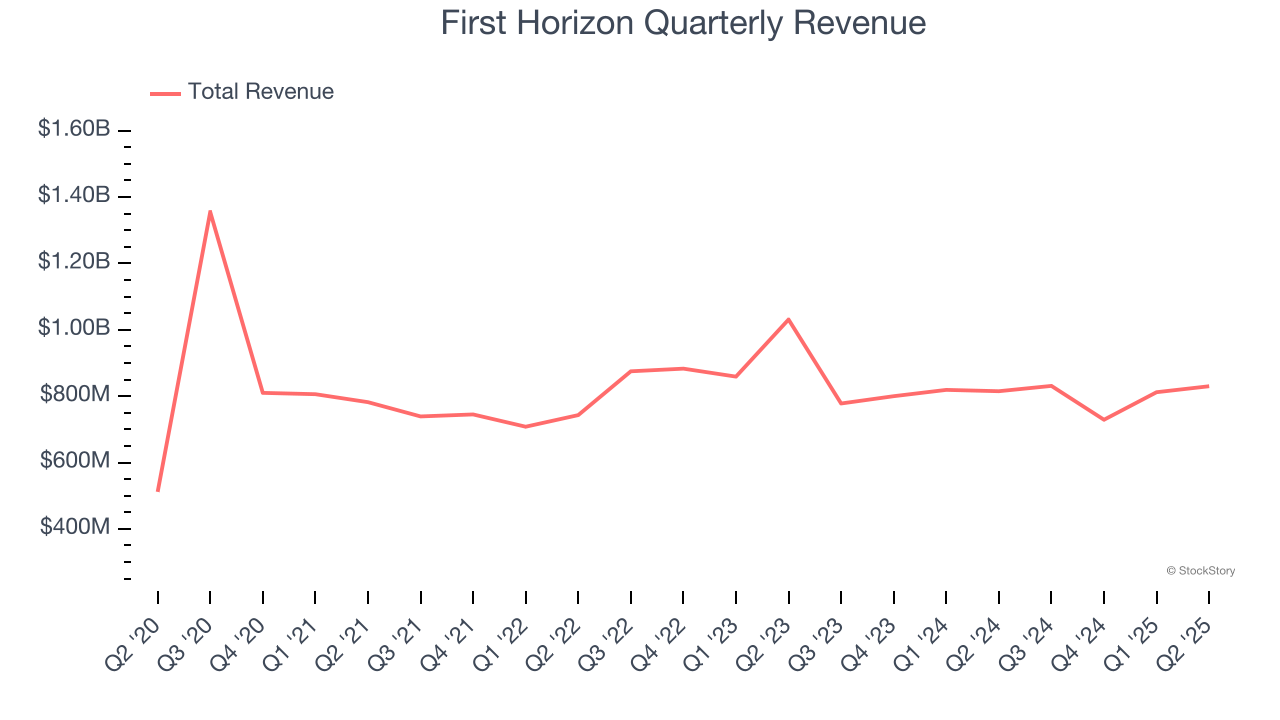
We at StockStory place the most emphasis on long-term growth, but within financials, a half-decade historical view may miss recent interest rate changes, market returns, and industry trends. First Horizon’s recent performance marks a sharp pivot from its five-year trend as its revenue has shown annualized declines of 6.3% over the last two years. 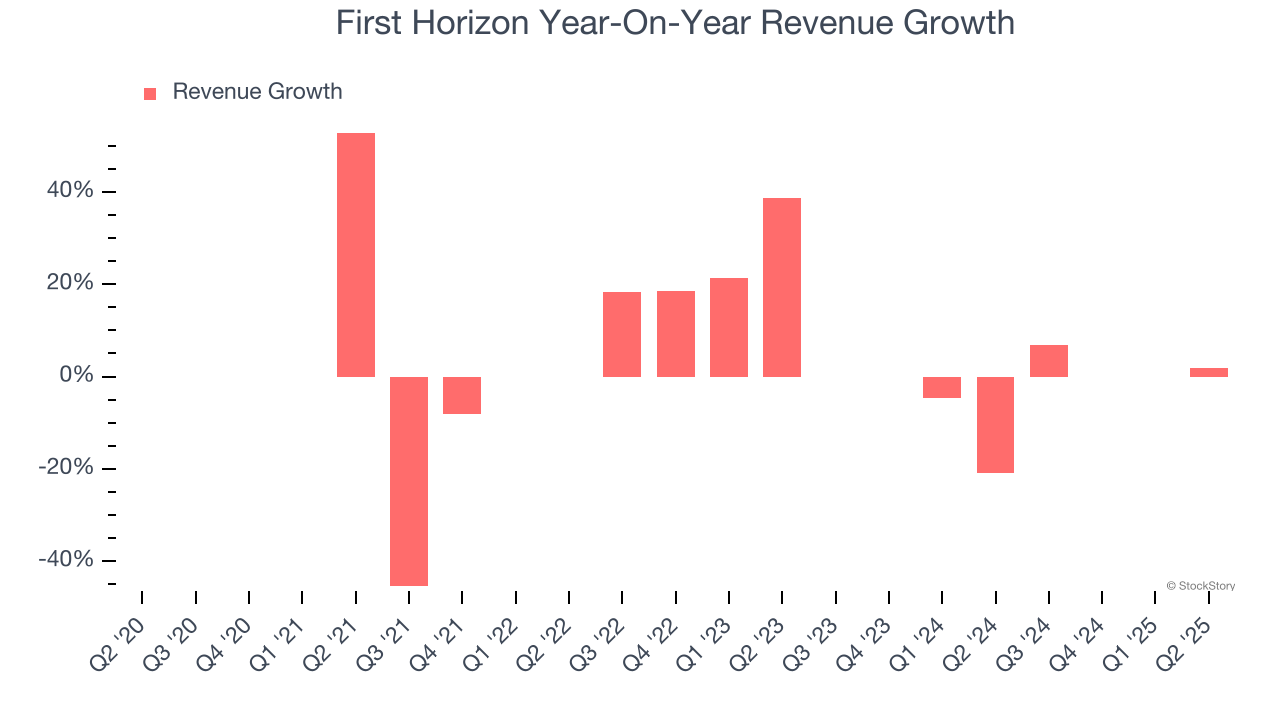 Note: Quarters not shown were determined to be outliers, impacted by outsized investment gains/losses that are not indicative of the recurring fundamentals of the business.
This quarter, First Horizon grew its revenue by 1.8% year on year, and its $830 million of revenue was in line with Wall Street’s estimates.
Net interest income made up 71.3% of the company’s total revenue during the last five years, meaning lending operations are First Horizon’s largest source of revenue.
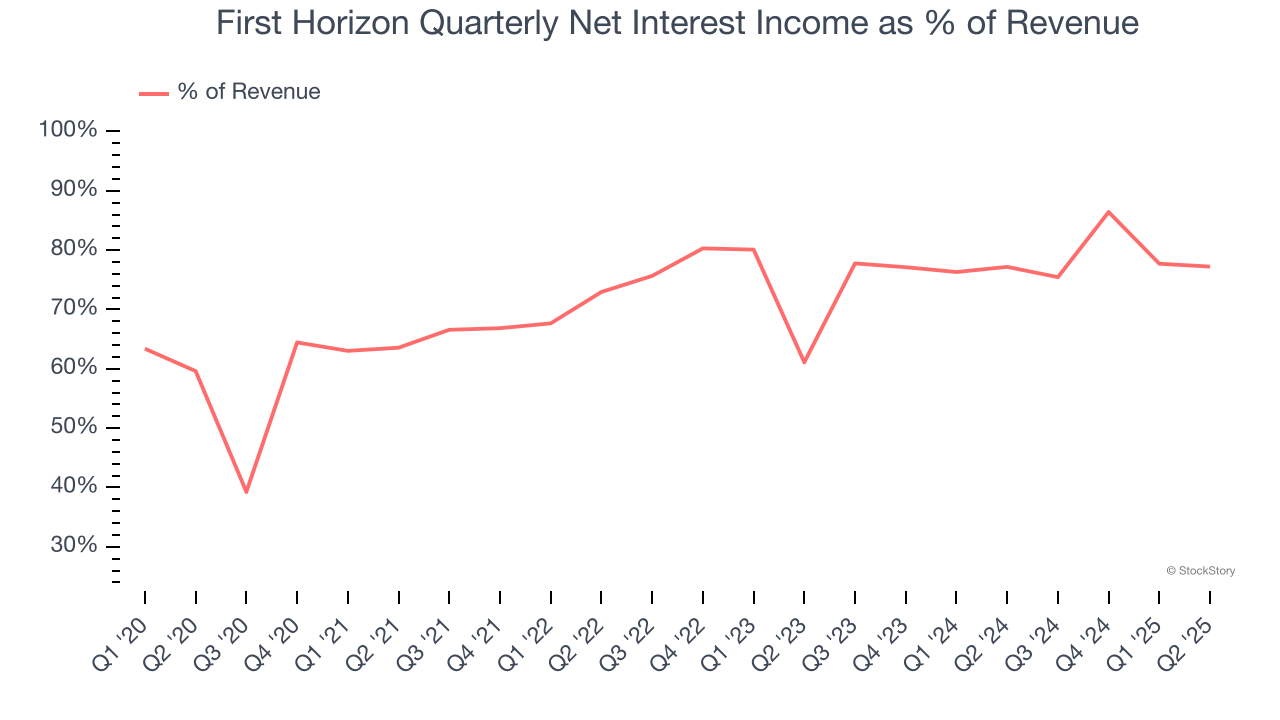
While banks generate revenue from multiple sources, investors view net interest income as the cornerstone - its predictable, recurring characteristics stand in sharp contrast to the volatility of non-interest income.
Software is eating the world and there is virtually no industry left that has been untouched by it. That drives increasing demand for tools helping software developers do their jobs, whether it be monitoring critical cloud infrastructure, integrating audio and video functionality, or ensuring smooth content streaming. Click here to access a free report on our 3 favorite stocks to play this generational megatrend.
Tangible Book Value Per Share (TBVPS)
The balance sheet drives banking profitability since earnings flow from the spread between borrowing and lending rates. As such, valuations for these companies concentrate on capital strength and sustainable equity accumulation potential.
When analyzing banks, tangible book value per share (TBVPS) takes precedence over many other metrics. This measure isolates genuine per-share value by removing intangible assets of debatable liquidation worth. Other (and more commonly known) per-share metrics like EPS can sometimes be murky due to M&A or accounting rules allowing for loan losses to be spread out.
First Horizon’s TBVPS grew at a solid 6.3% annual clip over the last five years. TBVPS growth has also accelerated recently, growing by 8.6% annually over the last two years from $11.50 to $13.57 per share.
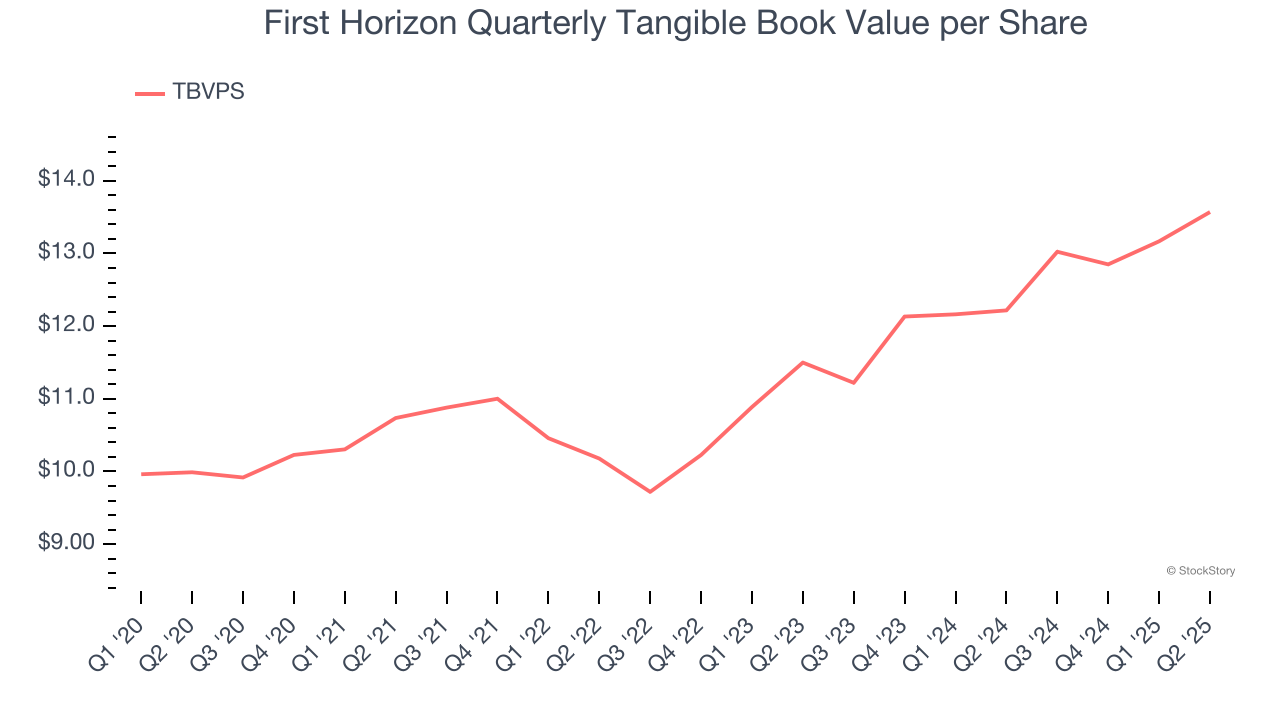
Over the next 12 months, Consensus estimates call for First Horizon’s TBVPS to grow by 6.5% to $14.45, mediocre growth rate.
Key Takeaways from First Horizon’s Q2 Results
Topline metrics such as net interest income and revenue were in line, but due to better operational efficiency, EPS beat. Zooming out, we think this was a solid quarter. The stock traded up 4.1% to $22.06 immediately after reporting.
So do we think First Horizon is an attractive buy at the current price? When making that decision, it’s important to consider its valuation, business qualities, as well as what has happened in the latest quarter. We cover that in our actionable full research report which you can read here, it’s free.