
Financial services company Triumph Financial (NASDAQ: TFIN) announced better-than-expected revenue in Q2 CY2025, with sales up 2.8% year on year to $108.1 million. Its GAAP profit of $0.15 per share was significantly above analysts’ consensus estimates.
Is now the time to buy Triumph Financial? Find out by accessing our full research report, it’s free.
Triumph Financial (TFIN) Q2 CY2025 Highlights:
- Net Interest Income: $88.68 million vs analyst estimates of $87.87 million (flat year on year, 0.9% beat)
- Net Interest Margin: 6.4% vs analyst estimates of 6.5% (64 basis point year-on-year decrease, 7.5 bps miss)
- Revenue: $108.1 million vs analyst estimates of $106.3 million (2.8% year-on-year growth, 1.7% beat)
- EPS (GAAP): $0.15 vs analyst estimates of $0.05 ($0.10 beat)
- Market Capitalization: $1.47 billion
Company Overview
Originally focused on traditional banking before pivoting to serve the transportation sector, Triumph Financial (NASDAQ: TFIN) provides specialized financial services to the trucking industry, including payments processing, factoring, banking, and data intelligence solutions.
Sales Growth
Net interest income and and fee-based revenue are the two pillars supporting bank earnings. The former captures profit from the gap between lending rates and deposit costs, while the latter encompasses charges for banking services, credit products, wealth management, and trading activities.
Thankfully, Triumph Financial’s 6.8% annualized revenue growth over the last five years was decent. Its growth was slightly above the average bank company and shows its offerings resonate with customers.
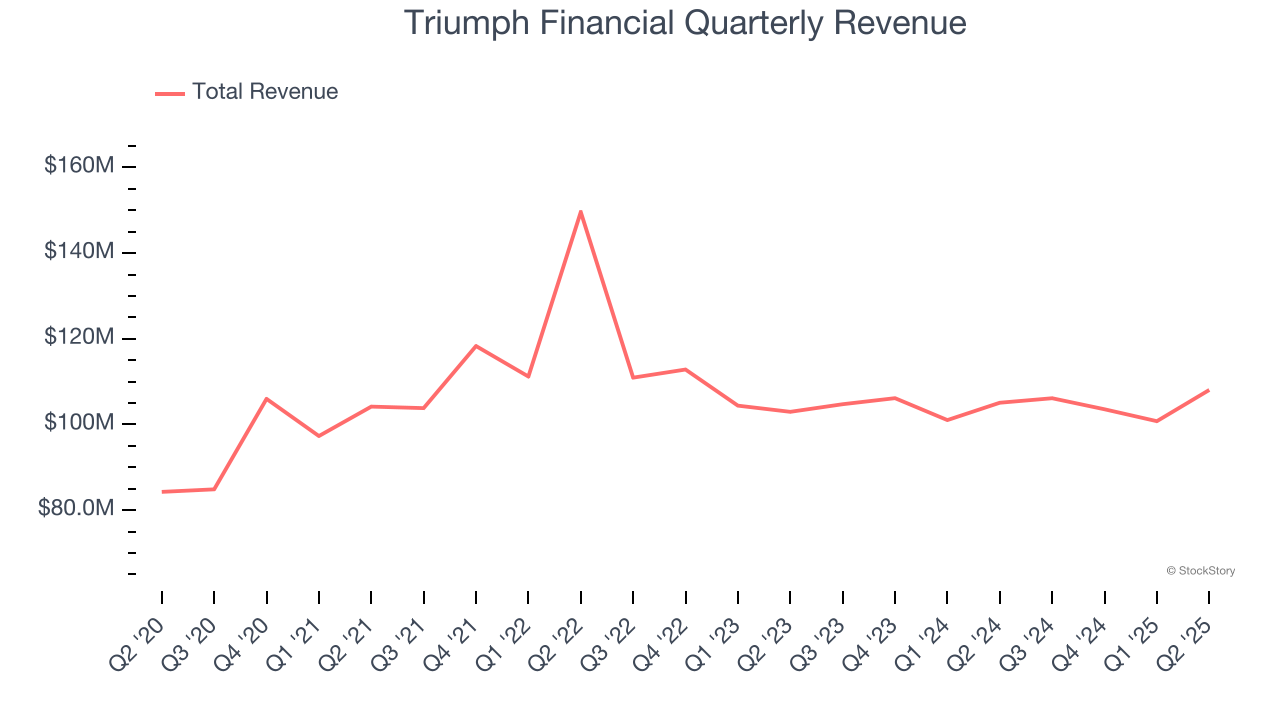
We at StockStory place the most emphasis on long-term growth, but within financials, a half-decade historical view may miss recent interest rate changes, market returns, and industry trends. Triumph Financial’s recent performance marks a sharp pivot from its five-year trend as its revenue has shown annualized declines of 1.5% over the last two years. 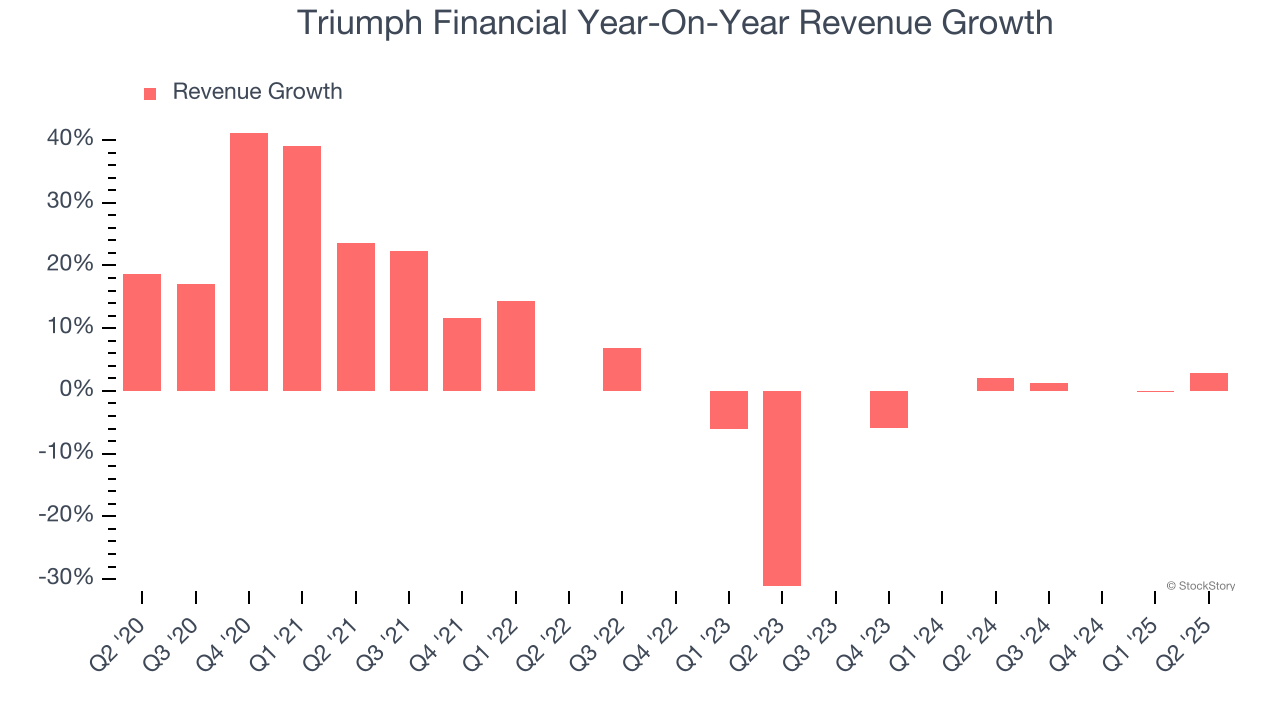 Note: Quarters not shown were determined to be outliers, impacted by outsized investment gains/losses that are not indicative of the recurring fundamentals of the business.
This quarter, Triumph Financial reported modest year-on-year revenue growth of 2.8% but beat Wall Street’s estimates by 1.7%.
Net interest income made up 85.3% of the company’s total revenue during the last five years, meaning Triumph Financial barely relies on non-interest income to drive its overall growth.
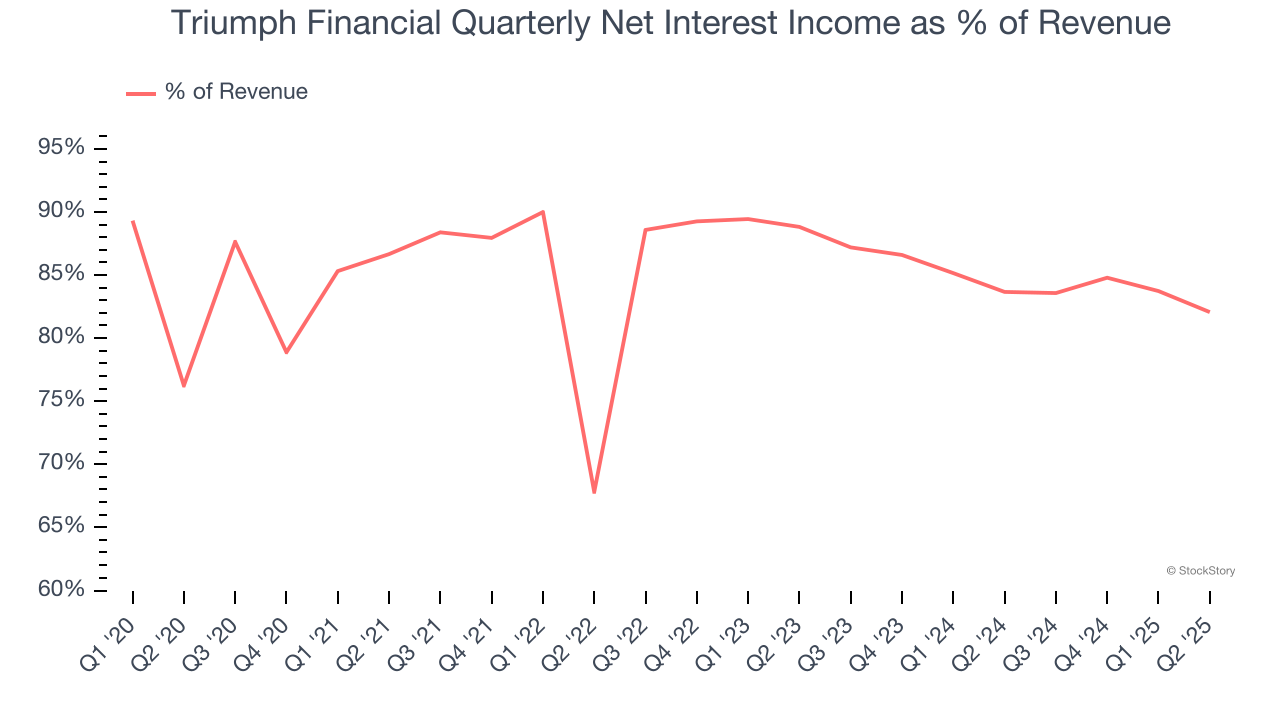
Markets consistently prioritize net interest income growth over fee-based revenue, recognizing its superior quality and recurring nature compared to the more unpredictable non-interest income streams.
Software is eating the world and there is virtually no industry left that has been untouched by it. That drives increasing demand for tools helping software developers do their jobs, whether it be monitoring critical cloud infrastructure, integrating audio and video functionality, or ensuring smooth content streaming. Click here to access a free report on our 3 favorite stocks to play this generational megatrend.
Tangible Book Value Per Share (TBVPS)
Banks are balance sheet-driven businesses because they generate earnings primarily through borrowing and lending. They’re also valued based on their balance sheet strength and ability to compound book value (another name for shareholders’ equity) over time.
This is why we consider tangible book value per share (TBVPS) the most important metric to track for banks. TBVPS represents the real, liquid net worth per share of a bank, excluding intangible assets that have debatable value upon liquidation. On the other hand, EPS is often distorted by mergers and flexible loan loss accounting. TBVPS provides clearer performance insights.
Triumph Financial’s TBVPS grew at a sluggish 1.8% annual clip over the last five years. On a two-year basis, however, dynamics have changed as TBVPS dropped by 7.8% annually ($22.70 to $19.31 per share).
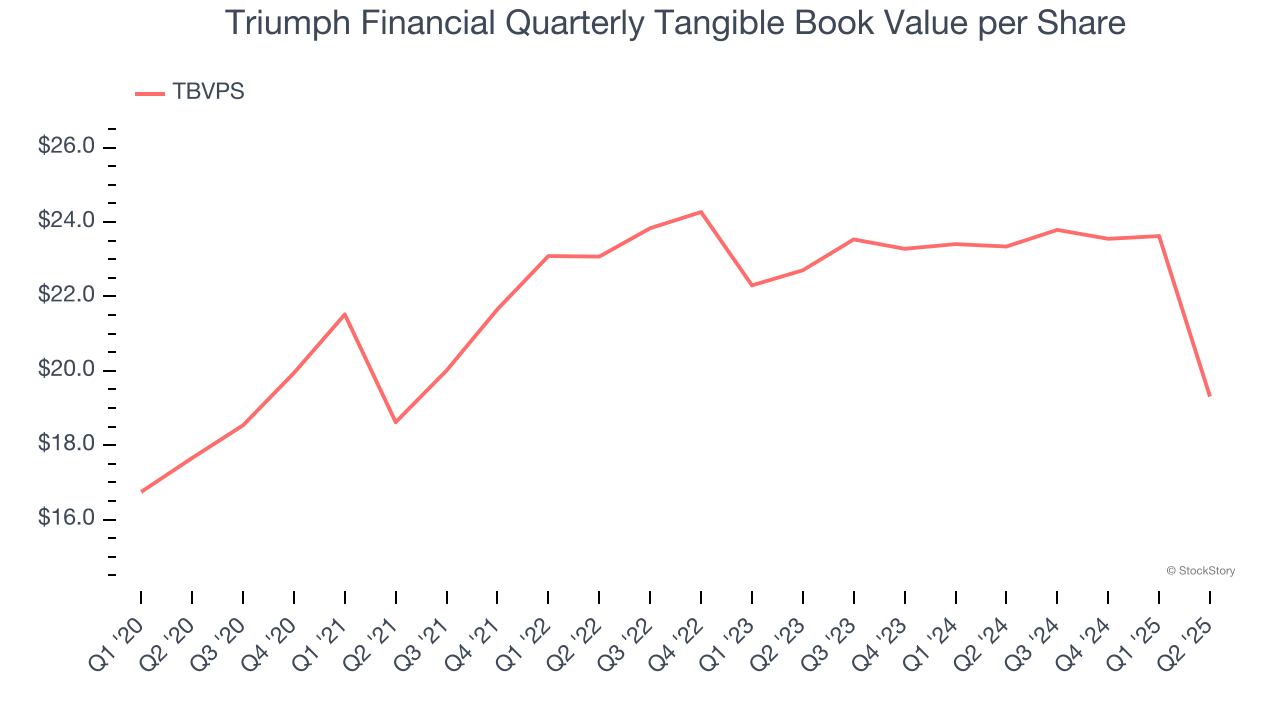
Over the next 12 months, Consensus estimates call for Triumph Financial’s TBVPS to grow by 38.7% to $26.79, elite growth rate.
Key Takeaways from Triumph Financial’s Q2 Results
We liked how revenue and EPS beat analysts’ EPS expectations this quarter. On the other hand, its net interest margin missed and its tangible book value per share missed as well. Overall, we think this was a mixed quarter. The market seemed to be hoping for more, and the stock traded down 2% to $62.11 immediately after reporting.
Is Triumph Financial an attractive investment opportunity at the current price? The latest quarter does matter, but not nearly as much as longer-term fundamentals and valuation, when deciding if the stock is a buy. We cover that in our actionable full research report which you can read here, it’s free.