Since January 2025, CACI has been in a holding pattern, posting a small return of 4.7% while floating around $473.65.
Is now the time to buy CACI? Or does the price properly account for its business quality and fundamentals? Find out in our full research report, it’s free.
Why Does CACI Spark Debate?
Founded to commercialize SIMSCRIPT, CACI International (NYSE: CACI) offers defense, intelligence, and IT solutions to support national security and government transformation efforts.
Two Things to Like:
1. Surging Backlog Locks In Future Sales
In addition to reported revenue, backlog is a useful data point for analyzing Defense Contractors companies. This metric shows the value of outstanding orders that have not yet been executed or delivered, giving visibility into CACI’s future revenue streams.
CACI’s backlog punched in at $31.4 billion in the latest quarter, and over the last two years, its year-on-year growth averaged 13%. This performance was impressive and shows the company has a robust sales pipeline because it is accumulating more orders than it can fulfill. Its growth also suggests that customers are committing to CACI for the long term, enhancing the business’s predictability. 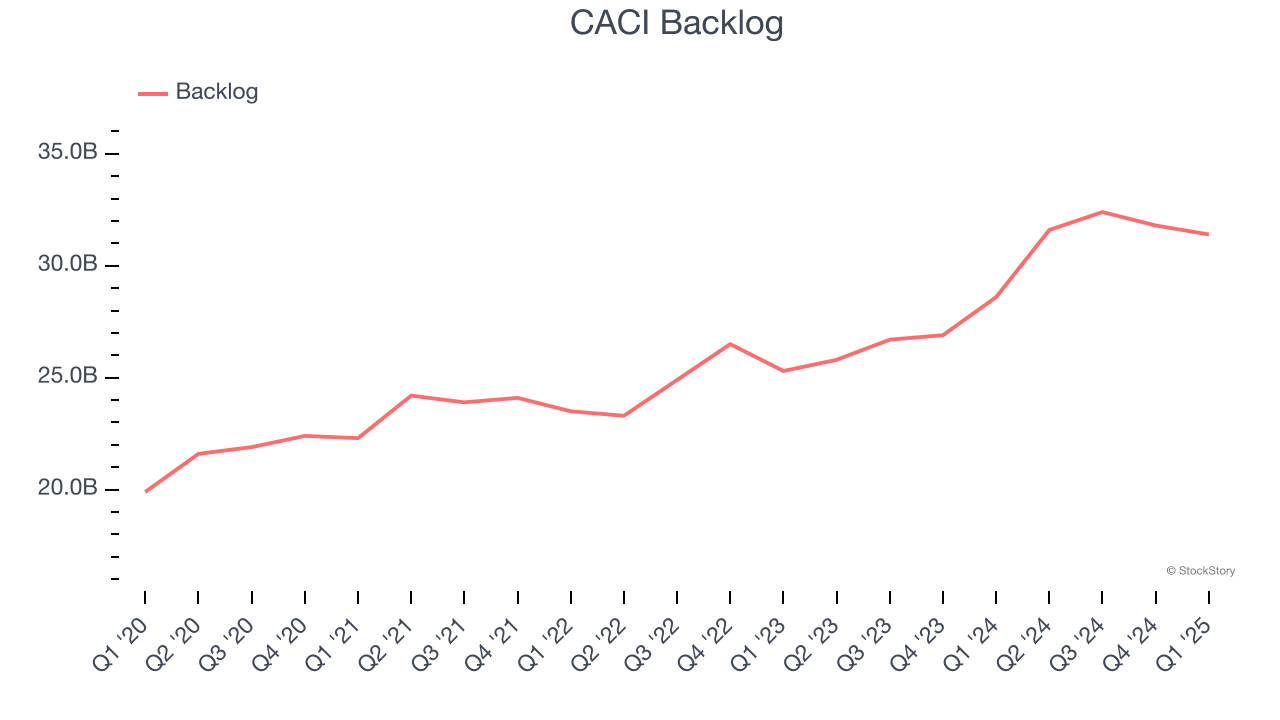
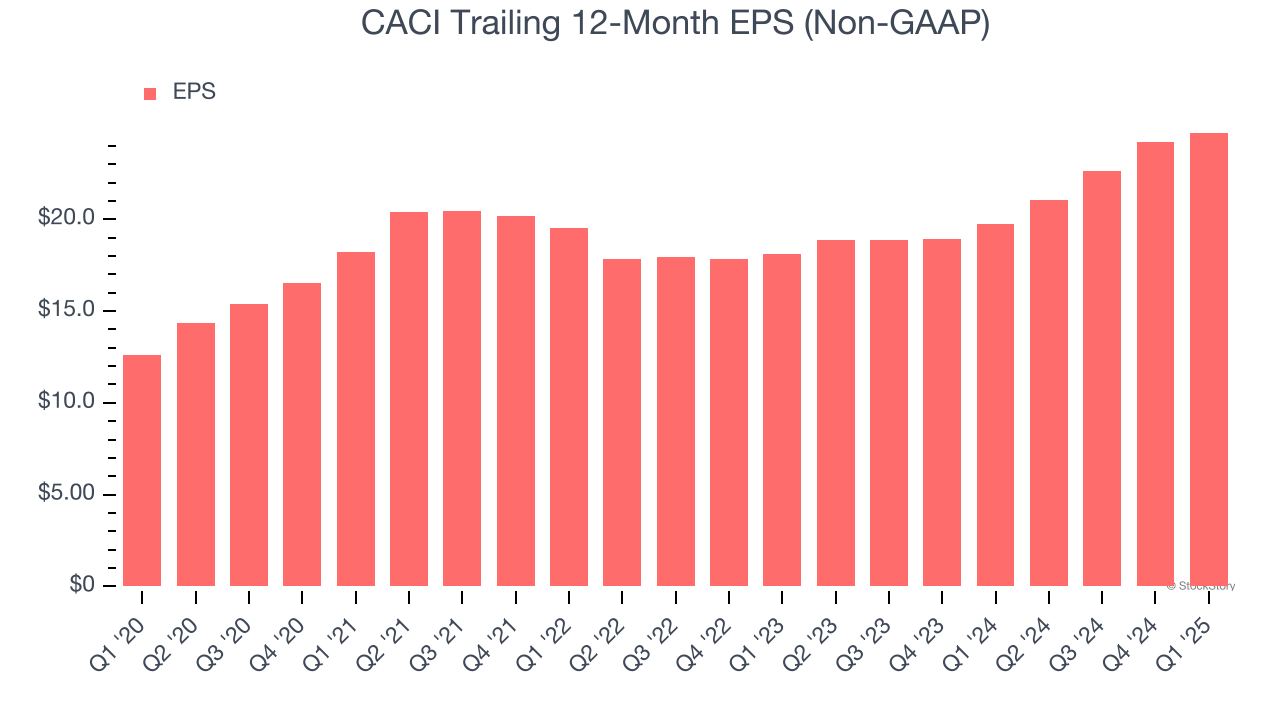
2. Outstanding Long-Term EPS Growth
We track the long-term change in earnings per share (EPS) because it highlights whether a company’s growth is profitable.
CACI’s EPS grew at a remarkable 14.4% compounded annual growth rate over the last five years, higher than its 8.4% annualized revenue growth. This tells us the company became more profitable on a per-share basis as it expanded.
One Reason to be Careful:
Free Cash Flow Margin Dropping
If you’ve followed StockStory for a while, you know we emphasize free cash flow. Why, you ask? We believe that in the end, cash is king, and you can’t use accounting profits to pay the bills.
As you can see below, CACI’s margin dropped by 4.1 percentage points over the last five years. If its declines continue, it could signal increasing investment needs and capital intensity. CACI’s free cash flow margin for the trailing 12 months was 5.8%.

Final Judgment
CACI has huge potential even though it has some open questions, but at $473.65 per share (or 17.8× forward P/E), is now the time to initiate a position? See for yourself in our in-depth research report, it’s free.
Stocks We Like Even More Than CACI
Market indices reached historic highs following Donald Trump’s presidential victory in November 2024, but the outlook for 2025 is clouded by new trade policies that could impact business confidence and growth.
While this has caused many investors to adopt a "fearful" wait-and-see approach, we’re leaning into our best ideas that can grow regardless of the political or macroeconomic climate. Take advantage of Mr. Market by checking out our Top 6 Stocks for this week. This is a curated list of our High Quality stocks that have generated a market-beating return of 183% over the last five years (as of March 31st 2025).
Stocks that made our list in 2020 include now familiar names such as Nvidia (+1,545% between March 2020 and March 2025) as well as under-the-radar businesses like the once-small-cap company Exlservice (+354% five-year return). Find your next big winner with StockStory today.
StockStory is growing and hiring equity analyst and marketing roles. Are you a 0 to 1 builder passionate about the markets and AI? See the open roles here.