
Puerto Rican financial services company OFG Bancorp (NYSE: OFG) met Wall Street’s revenue expectations in Q2 CY2025, with sales up 1.3% year on year to $182.2 million. Its GAAP profit of $1.15 per share was 9.5% above analysts’ consensus estimates.
Is now the time to buy OFG Bancorp? Find out by accessing our full research report, it’s free.
OFG Bancorp (OFG) Q2 CY2025 Highlights:
- Net Interest Income: $151.9 million vs analyst estimates of $151.6 million (3.1% year-on-year growth, in line)
- Net Interest Margin: 5.3% vs analyst estimates of 5.4% (32 basis point year-on-year decrease, 9 bps miss)
- Revenue: $182.2 million vs analyst estimates of $181.7 million (1.3% year-on-year growth, in line)
- Efficiency Ratio: 52% vs analyst estimates of 52.5% (0.4 percentage point beat)
- EPS (GAAP): $1.15 vs analyst estimates of $1.05 (9.5% beat)
- Market Capitalization: $1.98 billion
Company Overview
Originally founded in 1964 as a federal savings and loan institution, OFG Bancorp (NYSE: OFG) provides banking and financial services including commercial and consumer lending, wealth management, insurance, and trust services primarily in Puerto Rico and the U.S. Virgin Islands.
Sales Growth
Net interest income and and fee-based revenue are the two pillars supporting bank earnings. The former captures profit from the gap between lending rates and deposit costs, while the latter encompasses charges for banking services, credit products, wealth management, and trading activities.
Luckily, OFG Bancorp’s revenue grew at a decent 6.1% compounded annual growth rate over the last five years. Its growth was slightly above the average bank company and shows its offerings resonate with customers.
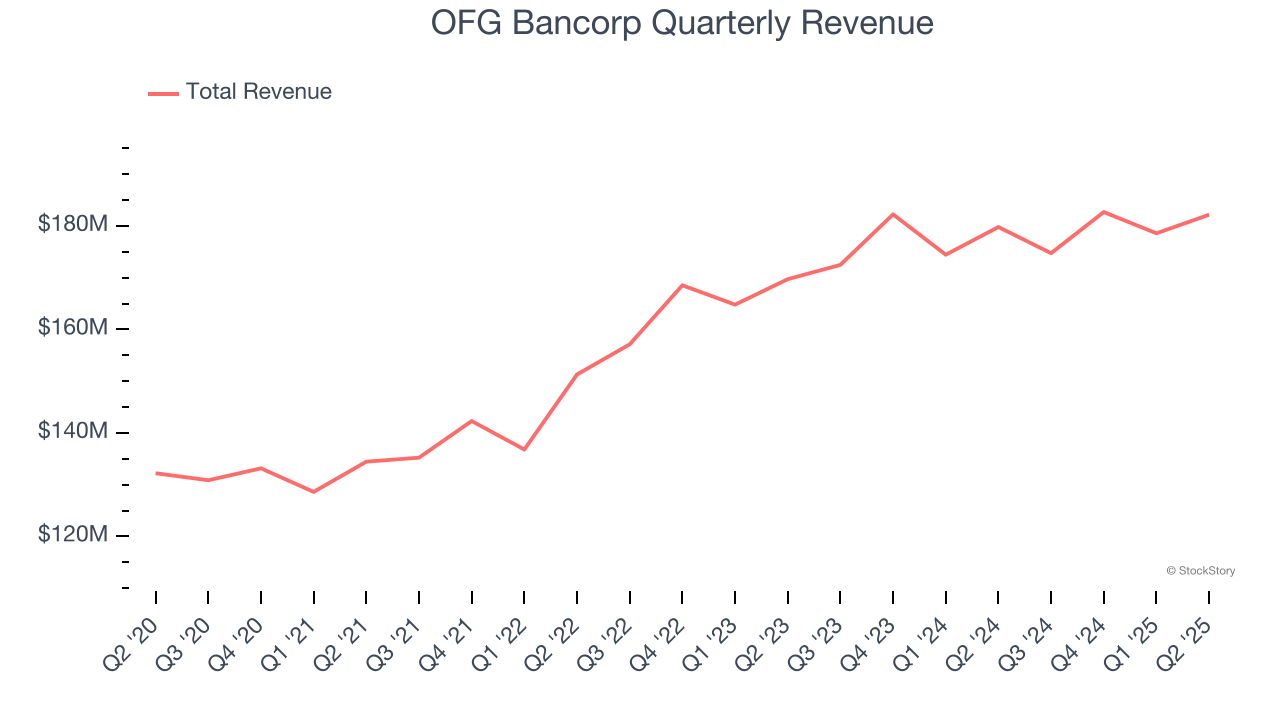
Long-term growth is the most important, but within financials, a half-decade historical view may miss recent interest rate changes and market returns. OFG Bancorp’s recent performance shows its demand has slowed as its annualized revenue growth of 4.3% over the last two years was below its five-year trend. 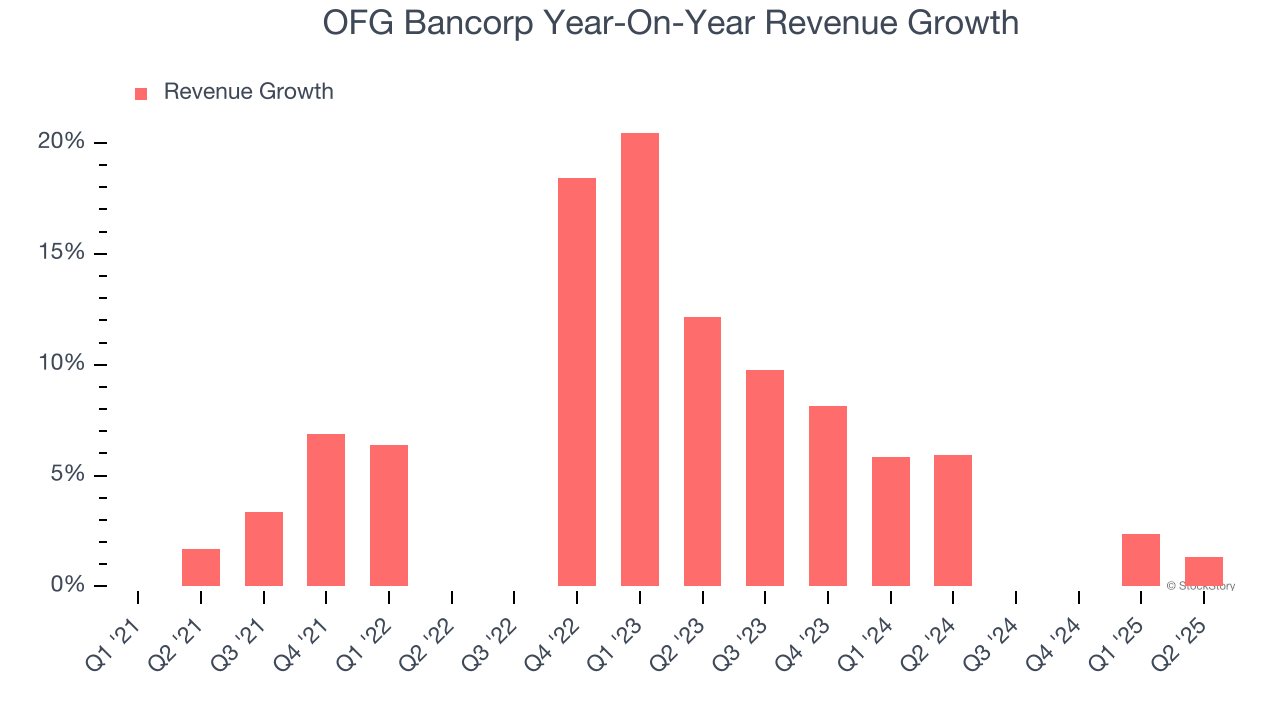 Note: Quarters not shown were determined to be outliers, impacted by outsized investment gains/losses that are not indicative of the recurring fundamentals of the business.
This quarter, OFG Bancorp grew its revenue by 1.3% year on year, and its $182.2 million of revenue was in line with Wall Street’s estimates.
Net interest income made up 79.4% of the company’s total revenue during the last five years, meaning lending operations are OFG Bancorp’s largest source of revenue.
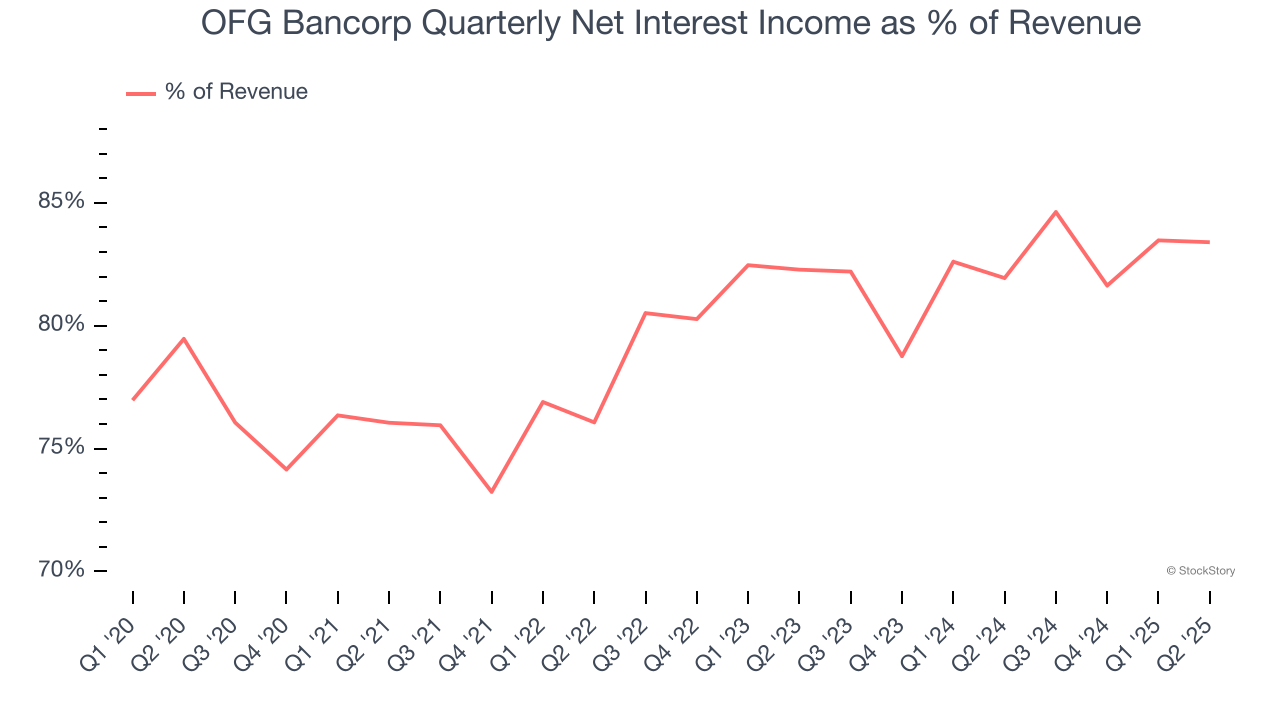
Markets consistently prioritize net interest income growth over fee-based revenue, recognizing its superior quality and recurring nature compared to the more unpredictable non-interest income streams.
Software is eating the world and there is virtually no industry left that has been untouched by it. That drives increasing demand for tools helping software developers do their jobs, whether it be monitoring critical cloud infrastructure, integrating audio and video functionality, or ensuring smooth content streaming. Click here to access a free report on our 3 favorite stocks to play this generational megatrend.
Tangible Book Value Per Share (TBVPS)
Banks are balance sheet-driven businesses because they generate earnings primarily through borrowing and lending. They’re also valued based on their balance sheet strength and ability to compound book value (another name for shareholders’ equity) over time.
This explains why tangible book value per share (TBVPS) stands as the premier banking metric. TBVPS strips away questionable intangible assets, revealing concrete per-share net worth that investors can trust. EPS can become murky due to acquisition impacts or accounting flexibility around loan provisions, and TBVPS resists financial engineering manipulation.
OFG Bancorp’s TBVPS grew at an incredible 11.8% annual clip over the last five years. TBVPS growth has also accelerated recently, growing by 14.6% annually over the last two years from $21.06 to $27.67 per share.
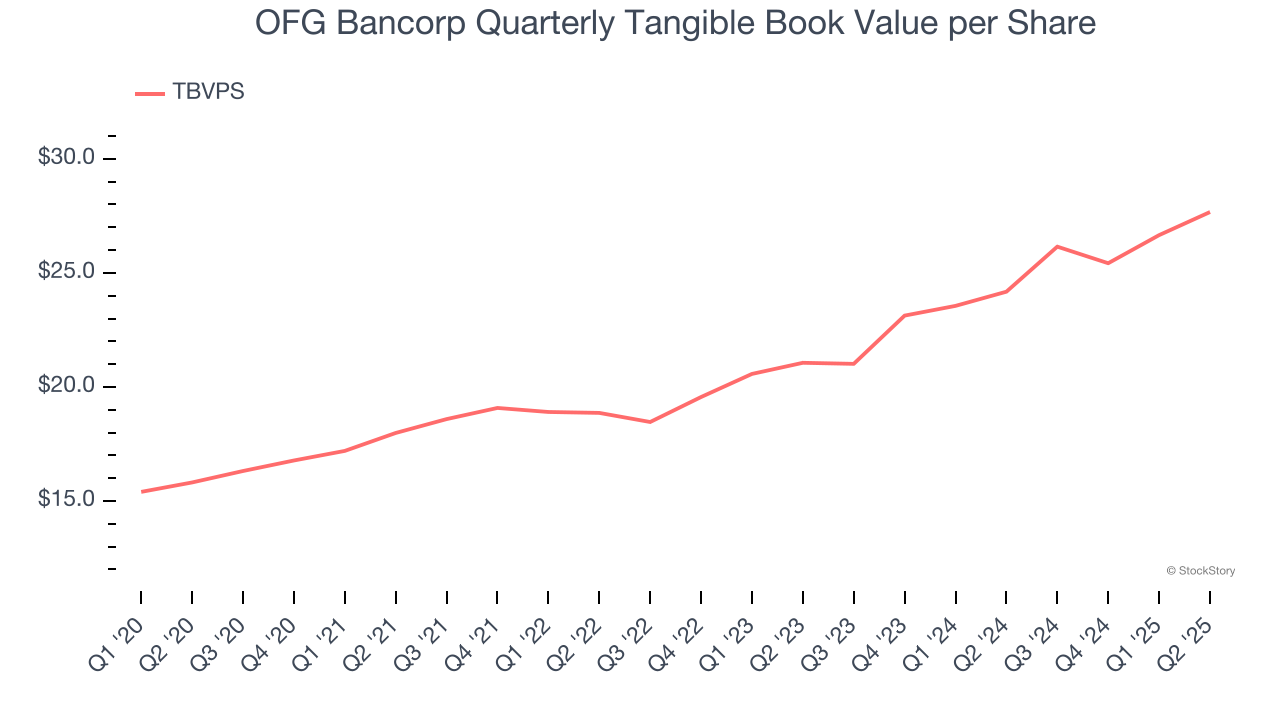
Over the next 12 months, Consensus estimates call for OFG Bancorp’s TBVPS to grow by 8.9% to $30.13, decent growth rate.
Key Takeaways from OFG Bancorp’s Q2 Results
It was encouraging to see OFG Bancorp beat analysts’ EPS expectations this quarter. We were also happy its tangible book value per share narrowly outperformed Wall Street’s estimates. On the other hand, net interest margin missed slightly. Still, this print had some key positives. The stock traded up 1.8% to $44.69 immediately following the results.
Should you buy the stock or not? If you’re making that decision, you should consider the bigger picture of valuation, business qualities, as well as the latest earnings. We cover that in our actionable full research report which you can read here, it’s free.