
Regional banking company Simmons First National (NASDAQ: SFNC) fell short of the market’s revenue expectations in Q2 CY2025, but sales rose 8.6% year on year to $214.2 million. Its non-GAAP profit of $0.44 per share was 12.8% above analysts’ consensus estimates.
Is now the time to buy Simmons First National? Find out by accessing our full research report, it’s free.
Simmons First National (SFNC) Q2 CY2025 Highlights:
- Net Interest Income: $171.8 million vs analyst estimates of $170.7 million (11.6% year-on-year growth, 0.7% beat)
- Net Interest Margin: 3.1% vs analyst estimates of 3% (37 basis point year-on-year increase, 6.5 bps beat)
- Revenue: $214.2 million vs analyst estimates of $217.1 million (8.6% year-on-year growth, 1.4% miss)
- Efficiency Ratio: 62.8% vs analyst estimates of 63.1% (in line)
- Adjusted EPS: $0.44 vs analyst estimates of $0.39 (12.8% beat)
- Market Capitalization: $2.45 billion
Company Overview
With roots dating back to 1903 and a presence across Arkansas, Kansas, Missouri, Oklahoma, Tennessee, and Texas, Simmons First National (NASDAQ: SFNC) is a regional bank holding company that provides banking and financial services to individuals and businesses.
Sales Growth
In general, banks make money from two primary sources. The first is net interest income, which is interest earned on loans, mortgages, and investments in securities minus interest paid out on deposits. The second source is non-interest income, which can come from bank account, credit card, wealth management, investing banking, and trading fees.
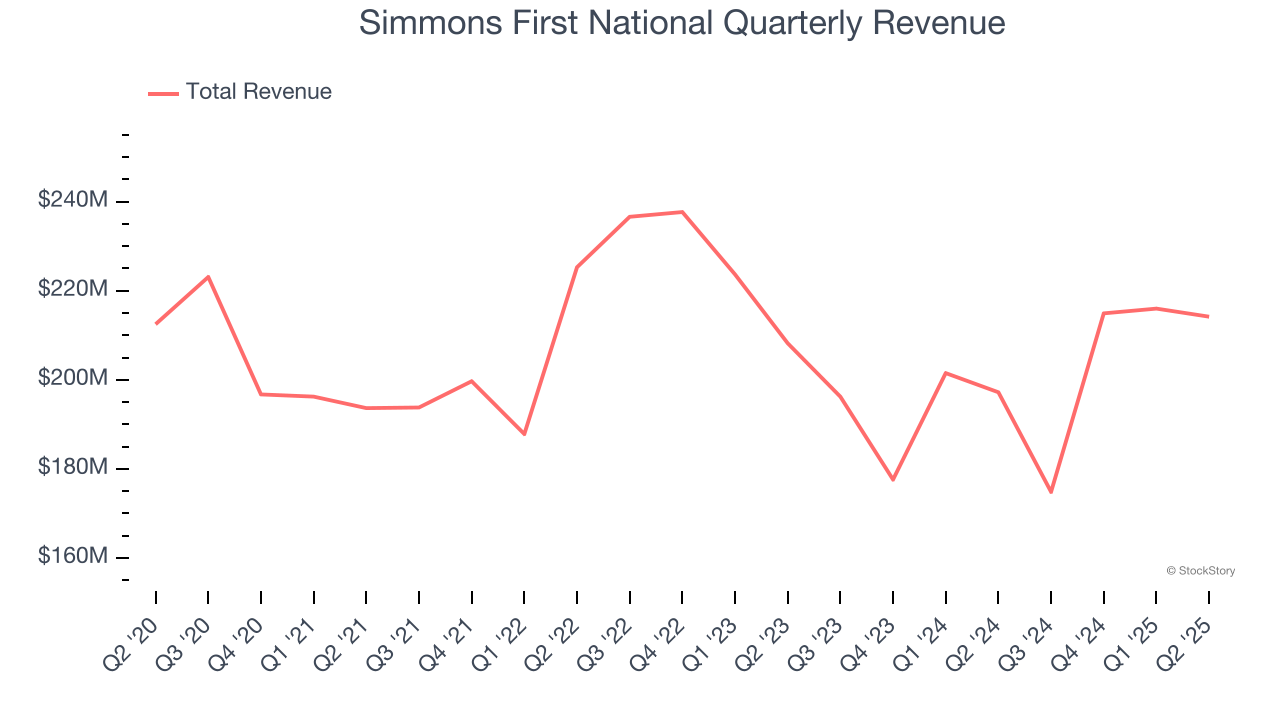
Over the last five years, Simmons First National’s demand was weak and its revenue declined by 2.1% per year. This wasn’t a great result and is a sign of poor business quality.
Long-term growth is the most important, but within financials, a half-decade historical view may miss recent interest rate changes and market returns. Simmons First National’s recent performance shows its demand remained suppressed as its revenue has declined by 4.9% annually over the last two years. 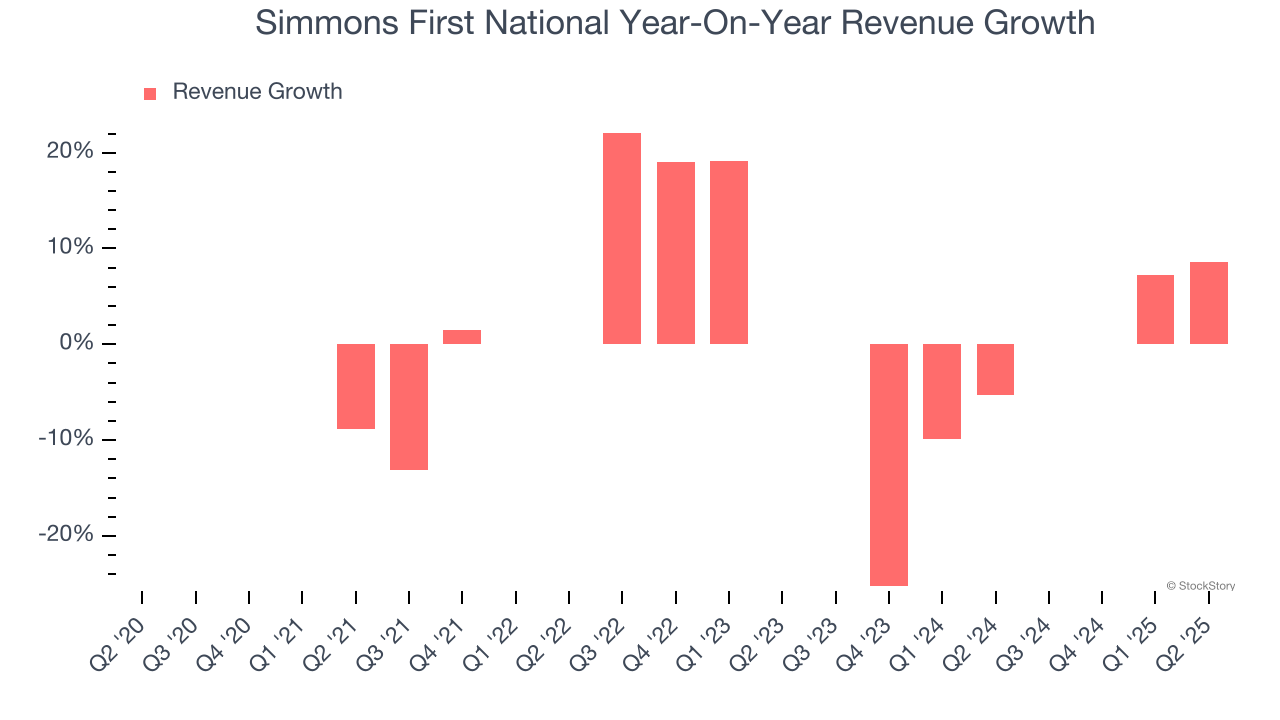 Note: Quarters not shown were determined to be outliers, impacted by outsized investment gains/losses that are not indicative of the recurring fundamentals of the business.
This quarter, Simmons First National’s revenue grew by 8.6% year on year to $214.2 million, missing Wall Street’s estimates.
Net interest income made up 78.6% of the company’s total revenue during the last five years, meaning lending operations are Simmons First National’s largest source of revenue.

While banks generate revenue from multiple sources, investors view net interest income as the cornerstone - its predictable, recurring characteristics stand in sharp contrast to the volatility of non-interest income.
Here at StockStory, we certainly understand the potential of thematic investing. Diverse winners from Microsoft (MSFT) to Alphabet (GOOG), Coca-Cola (KO) to Monster Beverage (MNST) could all have been identified as promising growth stories with a megatrend driving the growth. So, in that spirit, we’ve identified a relatively under-the-radar profitable growth stock benefiting from the rise of AI, available to you FREE via this link.
Tangible Book Value Per Share (TBVPS)
Banks are balance sheet-driven businesses because they generate earnings primarily through borrowing and lending. They’re also valued based on their balance sheet strength and ability to compound book value (another name for shareholders’ equity) over time.
When analyzing banks, tangible book value per share (TBVPS) takes precedence over many other metrics. This measure isolates genuine per-share value by removing intangible assets of debatable liquidation worth. EPS can become murky due to acquisition impacts or accounting flexibility around loan provisions, and TBVPS resists financial engineering manipulation.
Simmons First National’s TBVPS grew at a sluggish 1.4% annual clip over the last five years. However, TBVPS growth has accelerated recently, growing by 5.8% annually over the last two years from $15.17 to $16.97 per share.
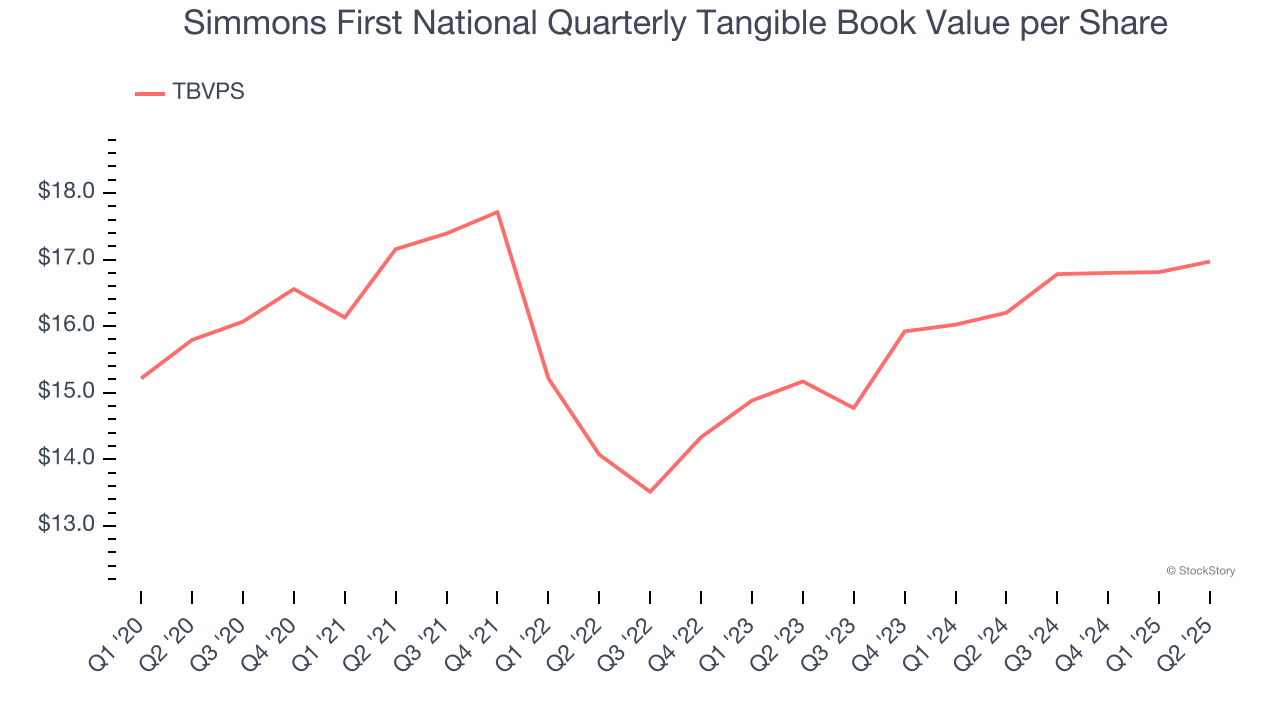
Over the next 12 months, Consensus estimates call for Simmons First National’s TBVPS to grow by 7.3% to $18.20, mediocre growth rate.
Key Takeaways from Simmons First National’s Q2 Results
We enjoyed seeing Simmons First National beat analysts’ net interest income, NIM, and EPS expectations this quarter. On the other hand, its revenue and tangible book value per share fell slightly short of Wall Street’s estimates. Zooming out, we think this was a mixed quarter. The stock remained flat at $19.80 immediately following the results.
Should you buy the stock or not? We think that the latest quarter is only one piece of the longer-term business quality puzzle. Quality, when combined with valuation, can help determine if the stock is a buy. We cover that in our actionable full research report which you can read here, it’s free.