Industrial conglomerate 3M (NYSE: MMM) reported Q2 CY2025 results exceeding the market’s revenue expectations, with sales up 1.4% year on year to $6.34 billion. Its non-GAAP profit of $2.16 per share was 7.4% above analysts’ consensus estimates.
Is now the time to buy 3M? Find out by accessing our full research report, it’s free.
3M (MMM) Q2 CY2025 Highlights:
- Revenue: $6.34 billion vs analyst estimates of $6.10 billion (1.4% year-on-year growth, 4% beat)
- Adjusted EPS: $2.16 vs analyst estimates of $2.01 (7.4% beat)
- Management raised its full-year Adjusted EPS guidance to $7.88 at the midpoint, a 1.6% increase
- Operating Margin: 18%, down from 20.3% in the same quarter last year
- Free Cash Flow was -$1.16 billion, down from $1.17 billion in the same quarter last year
- Organic Revenue rose 1.5% year on year, in line with the same quarter last year
- Market Capitalization: $85.59 billion
Company Overview
Producers of the first asthma inhaler, 3M Company (NYSE: MMM) is a global conglomerate known for products in industries like healthcare, safety, electronics, and consumer goods.
Revenue Growth
A company’s long-term sales performance is one signal of its overall quality. Any business can put up a good quarter or two, but the best consistently grow over the long haul. 3M’s demand was weak over the last five years as its sales fell at a 4.9% annual rate. This was below our standards and suggests it’s a low quality business.
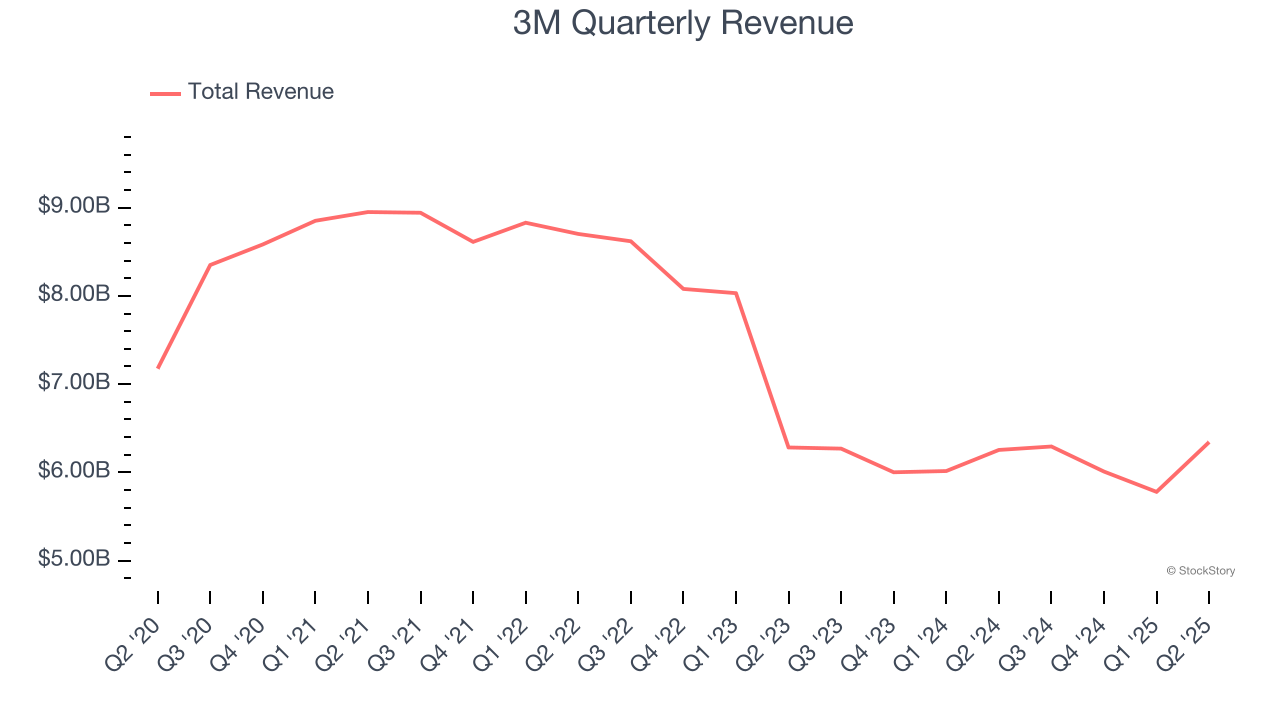
We at StockStory place the most emphasis on long-term growth, but within industrials, a half-decade historical view may miss cycles, industry trends, or a company capitalizing on catalysts such as a new contract win or a successful product line. 3M’s recent performance shows its demand remained suppressed as its revenue has declined by 11.2% annually over the last two years. 3M isn’t alone in its struggles as the General Industrial Machinery industry experienced a cyclical downturn, with many similar businesses observing lower sales at this time. 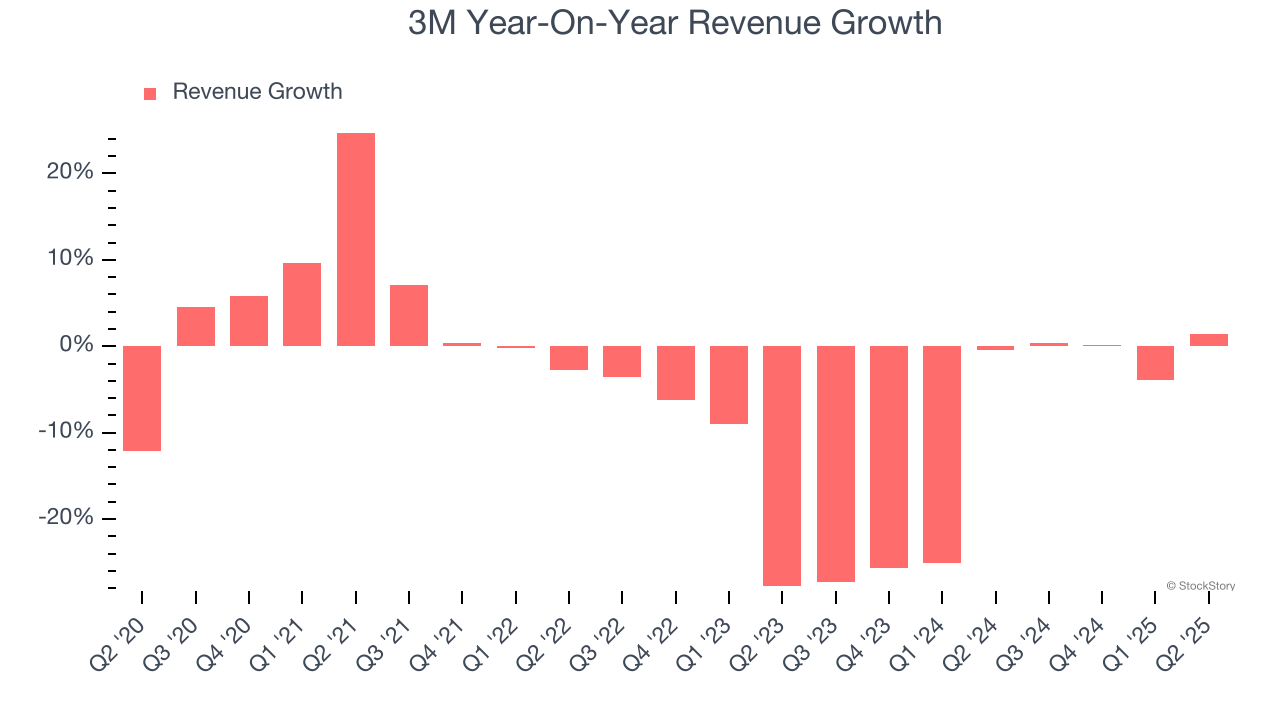
We can dig further into the company’s sales dynamics by analyzing its organic revenue, which strips out one-time events like acquisitions and currency fluctuations that don’t accurately reflect its fundamentals. Over the last two years, 3M’s organic revenue was flat. Because this number is better than its normal revenue growth, we can see that some mixture of divestitures and foreign exchange rates dampened its headline results. 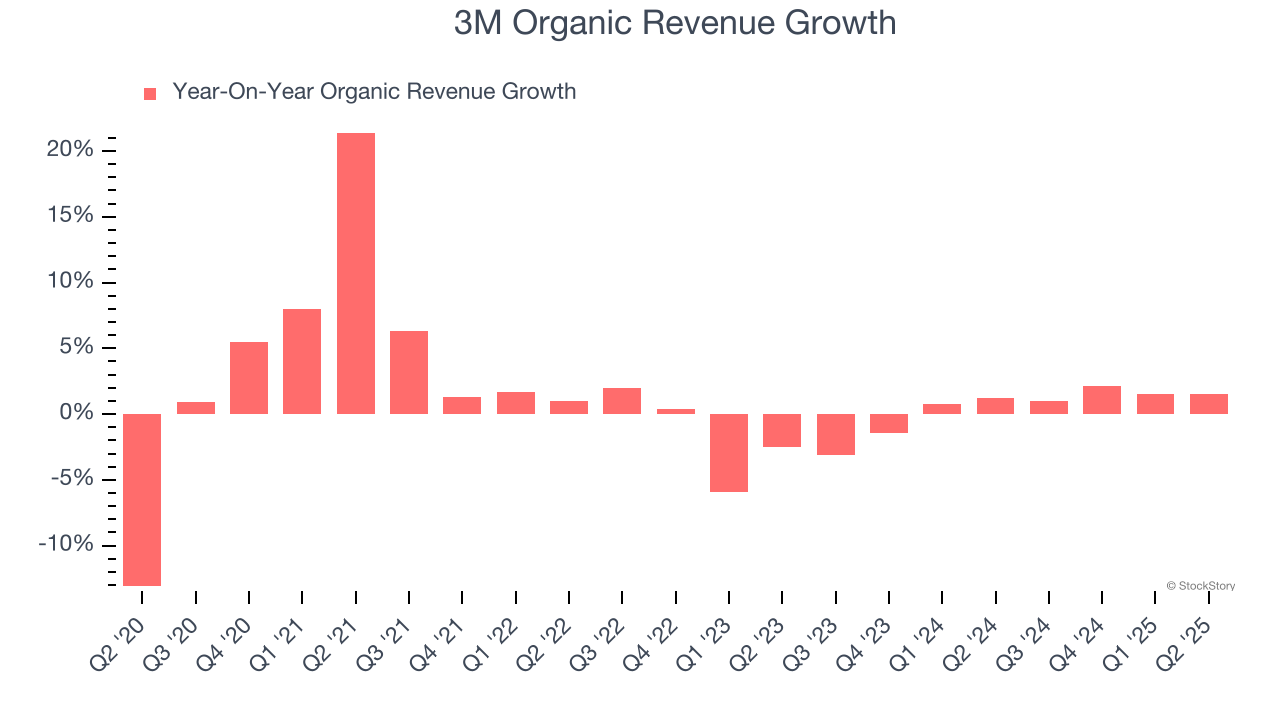
This quarter, 3M reported modest year-on-year revenue growth of 1.4% but beat Wall Street’s estimates by 4%.
Looking ahead, sell-side analysts expect revenue to remain flat over the next 12 months. While this projection suggests its newer products and services will catalyze better top-line performance, it is still below the sector average.
Unless you’ve been living under a rock, it should be obvious by now that generative AI is going to have a huge impact on how large corporations do business. While Nvidia and AMD are trading close to all-time highs, we prefer a lesser-known (but still profitable) stock benefiting from the rise of AI. Click here to access our free report one of our favorites growth stories.
Operating Margin
3M has done a decent job managing its cost base over the last five years. The company has produced an average operating margin of 9.7%, higher than the broader industrials sector.
Looking at the trend in its profitability, 3M’s operating margin decreased by 2.6 percentage points over the last five years. Even though its historical margin was healthy, shareholders will want to see 3M become more profitable in the future.
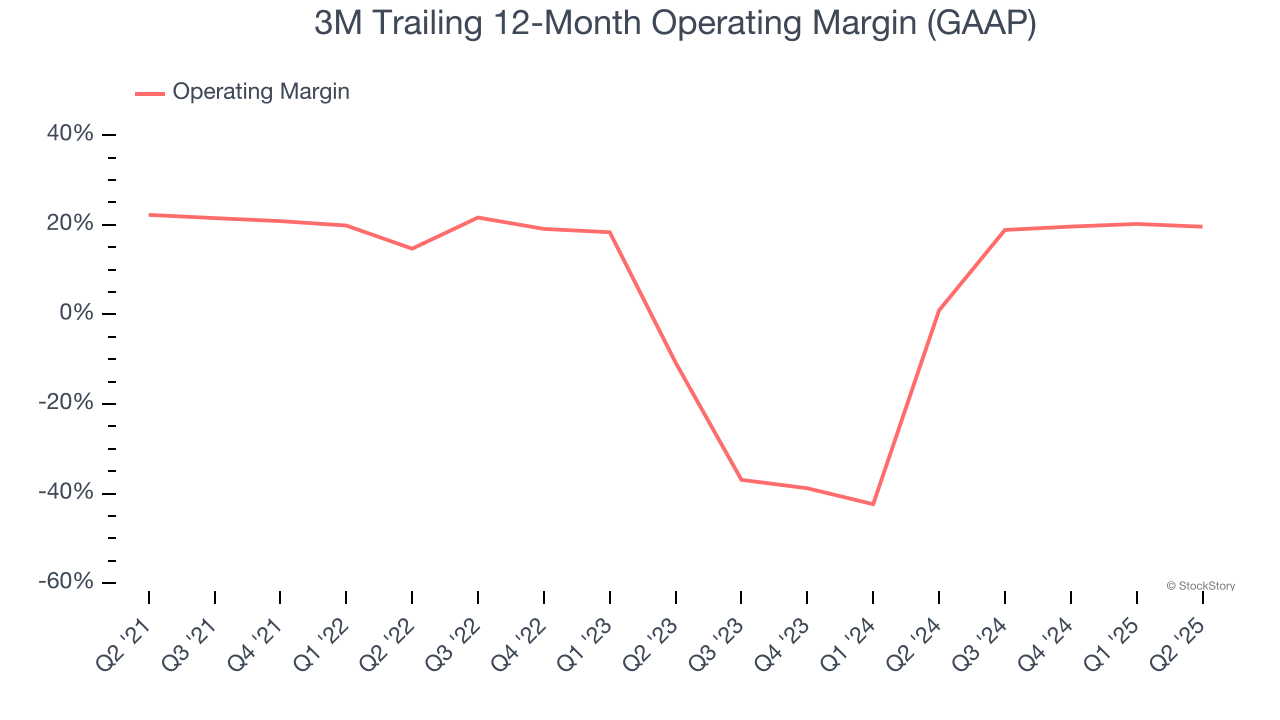
This quarter, 3M generated an operating margin profit margin of 18%, down 2.4 percentage points year on year. Since 3M’s operating margin decreased more than its gross margin, we can assume it was less efficient because expenses such as marketing, R&D, and administrative overhead increased.
Earnings Per Share
Revenue trends explain a company’s historical growth, but the long-term change in earnings per share (EPS) points to the profitability of that growth – for example, a company could inflate its sales through excessive spending on advertising and promotions.
Sadly for 3M, its EPS and revenue declined by 2.2% and 4.9% annually over the last five years. We tend to steer our readers away from companies with falling revenue and EPS, where diminishing earnings could imply changing secular trends and preferences. If the tide turns unexpectedly, 3M’s low margin of safety could leave its stock price susceptible to large downswings.
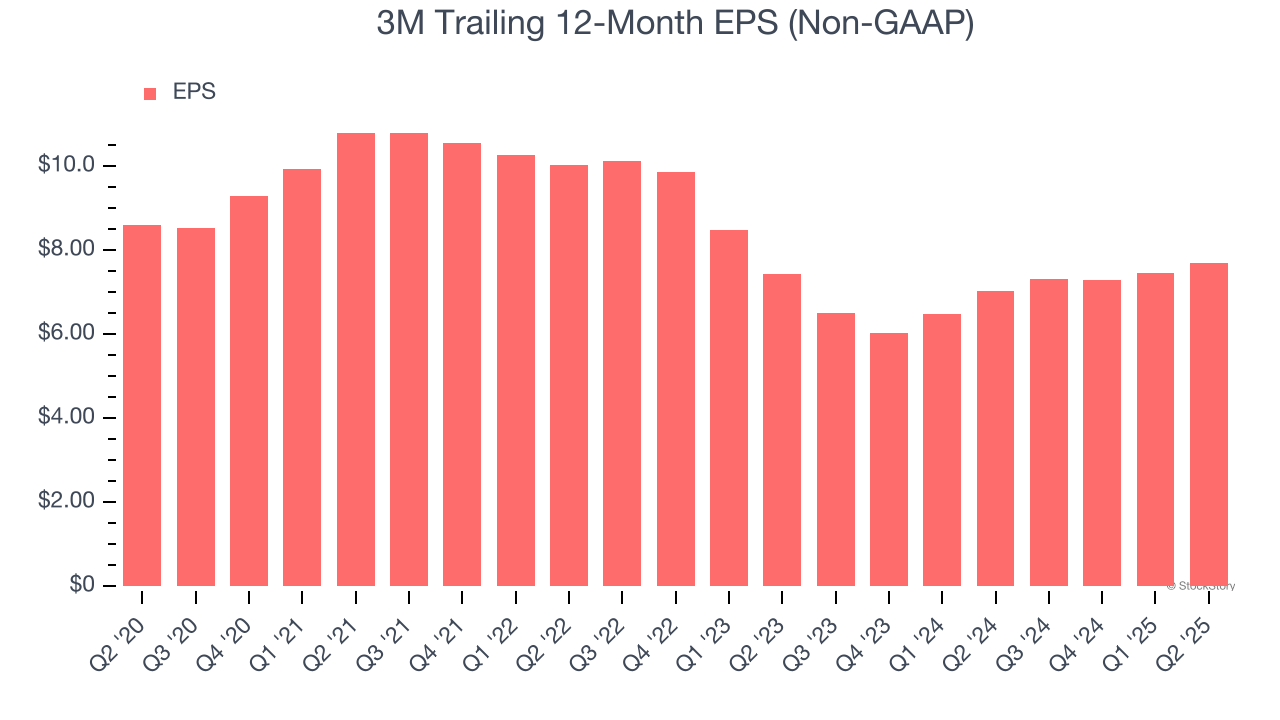
Like with revenue, we analyze EPS over a more recent period because it can provide insight into an emerging theme or development for the business.
For 3M, its two-year annual EPS growth of 1.8% was higher than its five-year trend. Accelerating earnings growth is almost always an encouraging data point.
In Q2, 3M reported EPS at $2.16, up from $1.93 in the same quarter last year. This print beat analysts’ estimates by 7.4%. Over the next 12 months, Wall Street expects 3M’s full-year EPS of $7.70 to grow 3.9%.
Key Takeaways from 3M’s Q2 Results
We were impressed by how significantly 3M blew past analysts’ revenue expectations this quarter. We were also glad its full-year EPS guidance exceeded Wall Street’s estimates. On the other hand, its organic revenue was in line. Overall, we think this was a solid quarter with some key areas of upside. The stock traded up 3.4% to $164.53 immediately after reporting.
3M put up rock-solid earnings, but one quarter doesn’t necessarily make the stock a buy. Let’s see if this is a good investment. We think that the latest quarter is only one piece of the longer-term business quality puzzle. Quality, when combined with valuation, can help determine if the stock is a buy. We cover that in our actionable full research report which you can read here, it’s free.