Enpro currently trades at $195.22 and has been a dream stock for shareholders. It’s returned 314% since July 2020, more than tripling the S&P 500’s 97.8% gain. The company has also beaten the index over the past six months as its stock price is up 15.4% thanks to its solid quarterly results.
Is now the time to buy Enpro, or should you be careful about including it in your portfolio? Dive into our full research report to see our analyst team’s opinion, it’s free.
Why Is Enpro Not Exciting?
Despite the momentum, we're sitting this one out for now. Here are three reasons why you should be careful with NPO and a stock we'd rather own.
1. Revenue Spiraling Downwards
A company’s long-term performance is an indicator of its overall quality. Any business can experience short-term success, but top-performing ones enjoy sustained growth for years. Enpro’s demand was weak over the last five years as its sales fell at a 2.1% annual rate. This was below our standards and signals it’s a lower quality business. 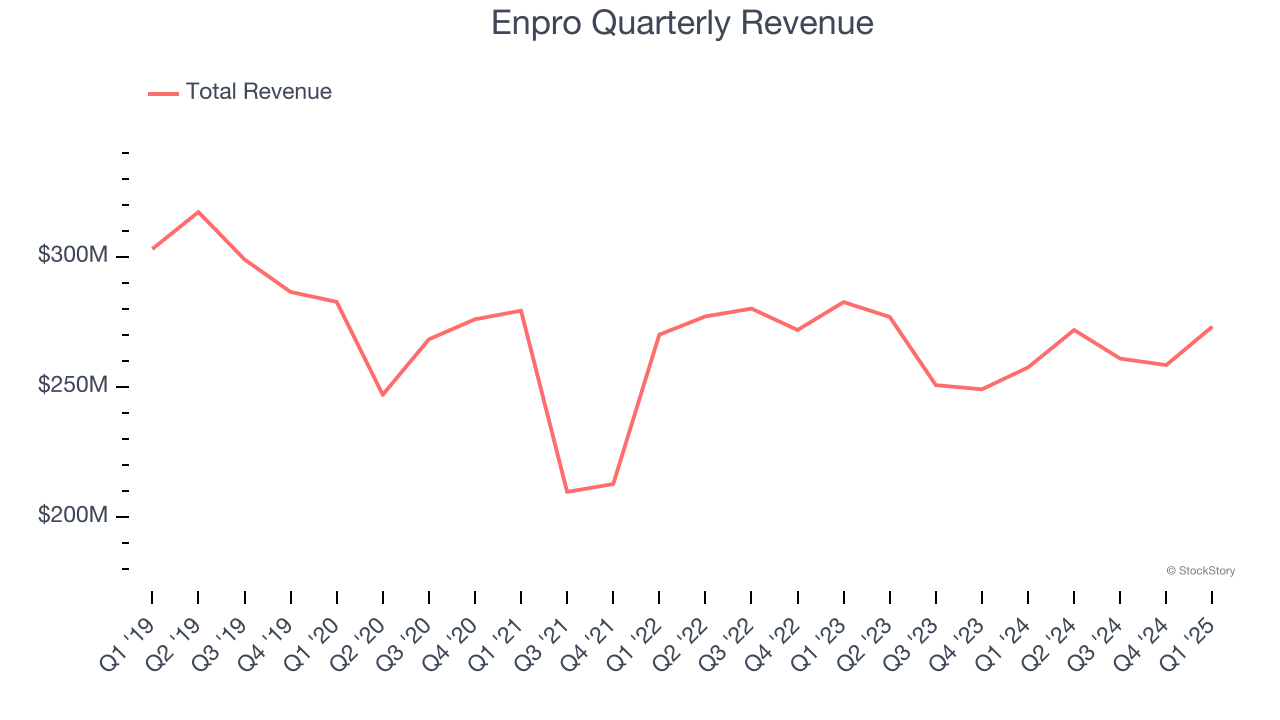
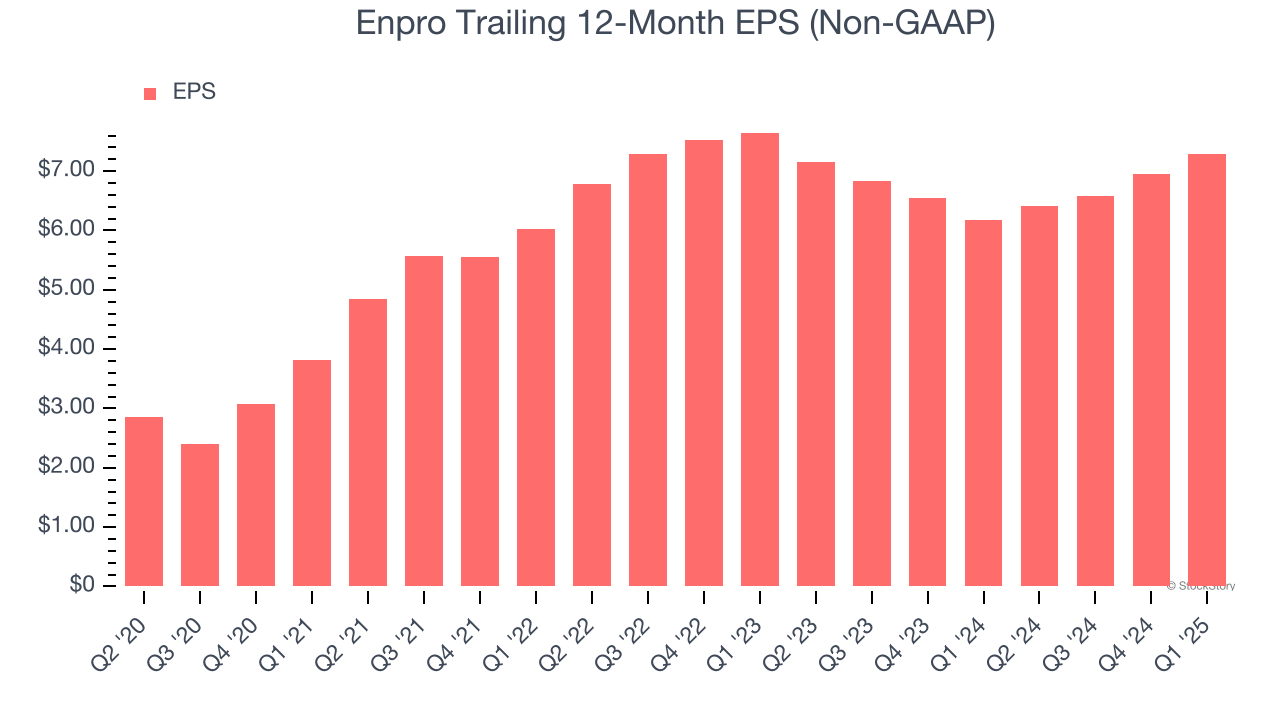
2. EPS Took a Dip Over the Last Two Years
Although long-term earnings trends give us the big picture, we like to analyze EPS over a shorter period to see if we are missing a change in the business.
Sadly for Enpro, its EPS and revenue declined by 2.4% and 2.2% annually over the last two years. We tend to steer our readers away from companies with falling revenue and EPS, where diminishing earnings could imply changing secular trends and preferences. If the tide turns unexpectedly, Enpro’s low margin of safety could leave its stock price susceptible to large downswings.
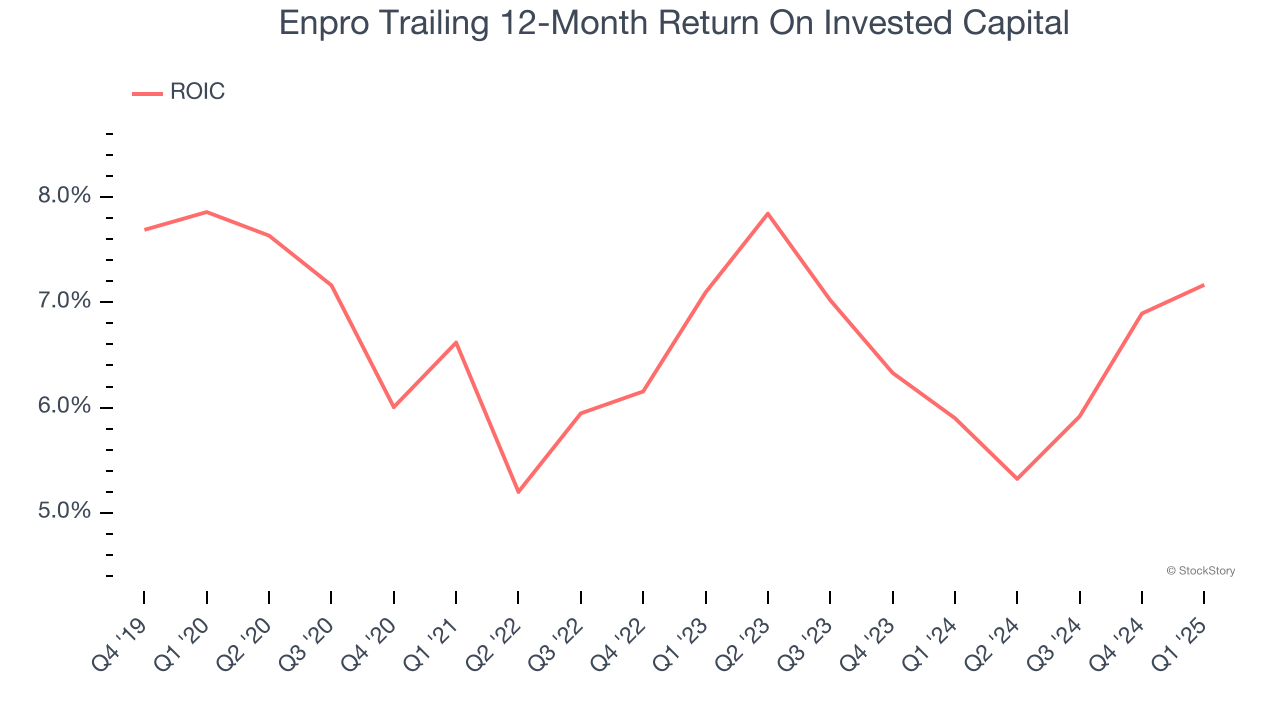
3. Previous Growth Initiatives Haven’t Impressed
Growth gives us insight into a company’s long-term potential, but how capital-efficient was that growth? A company’s ROIC explains this by showing how much operating profit it makes compared to the money it has raised (debt and equity).
Enpro historically did a mediocre job investing in profitable growth initiatives. Its five-year average ROIC was 6.7%, somewhat low compared to the best industrials companies that consistently pump out 20%+.
Final Judgment
Enpro isn’t a terrible business, but it doesn’t pass our bar. With its shares outperforming the market lately, the stock trades at 25.4× forward P/E (or $195.22 per share). At this valuation, there’s a lot of good news priced in - we think there are better opportunities elsewhere. We’d recommend looking at a safe-and-steady industrials business benefiting from an upgrade cycle.
Stocks We Would Buy Instead of Enpro
Market indices reached historic highs following Donald Trump’s presidential victory in November 2024, but the outlook for 2025 is clouded by new trade policies that could impact business confidence and growth.
While this has caused many investors to adopt a "fearful" wait-and-see approach, we’re leaning into our best ideas that can grow regardless of the political or macroeconomic climate. Take advantage of Mr. Market by checking out our Top 9 Market-Beating Stocks. This is a curated list of our High Quality stocks that have generated a market-beating return of 183% over the last five years (as of March 31st 2025).
Stocks that made our list in 2020 include now familiar names such as Nvidia (+1,545% between March 2020 and March 2025) as well as under-the-radar businesses like the once-micro-cap company Kadant (+351% five-year return). Find your next big winner with StockStory today.