
Over the past six months, Schneider’s shares (currently trading at $25.03) have posted a disappointing 14.1% loss, well below the S&P 500’s 5.6% gain. This might have investors contemplating their next move.
Is there a buying opportunity in Schneider, or does it present a risk to your portfolio? See what our analysts have to say in our full research report, it’s free.
Why Do We Think Schneider Will Underperform?
Despite the more favorable entry price, we're sitting this one out for now. Here are three reasons why we avoid SNDR and a stock we'd rather own.
1. Long-Term Revenue Growth Disappoints
A company’s long-term sales performance can indicate its overall quality. Even a bad business can shine for one or two quarters, but a top-tier one grows for years. Over the last five years, Schneider grew its sales at a sluggish 2.8% compounded annual growth rate. This fell short of our benchmarks. 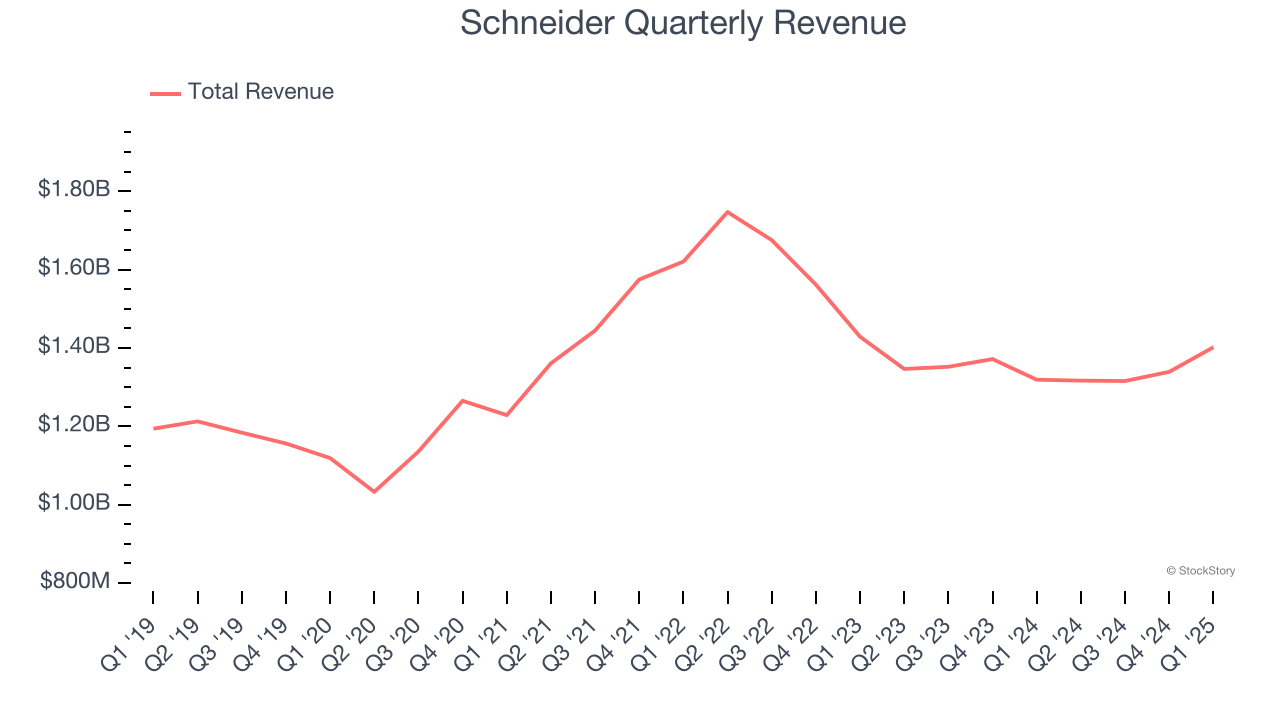
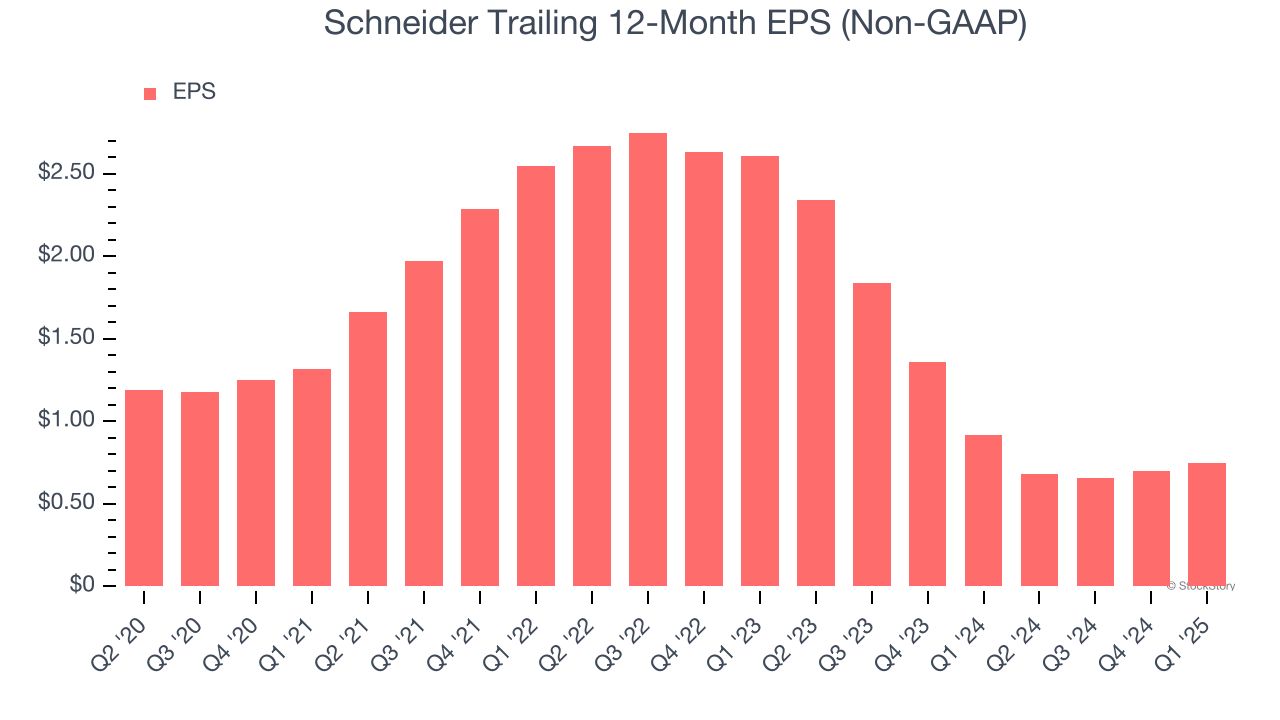
2. EPS Trending Down
We track the long-term change in earnings per share (EPS) because it highlights whether a company’s growth is profitable.
Sadly for Schneider, its EPS declined by 10.3% annually over the last five years while its revenue grew by 2.8%. This tells us the company became less profitable on a per-share basis as it expanded.
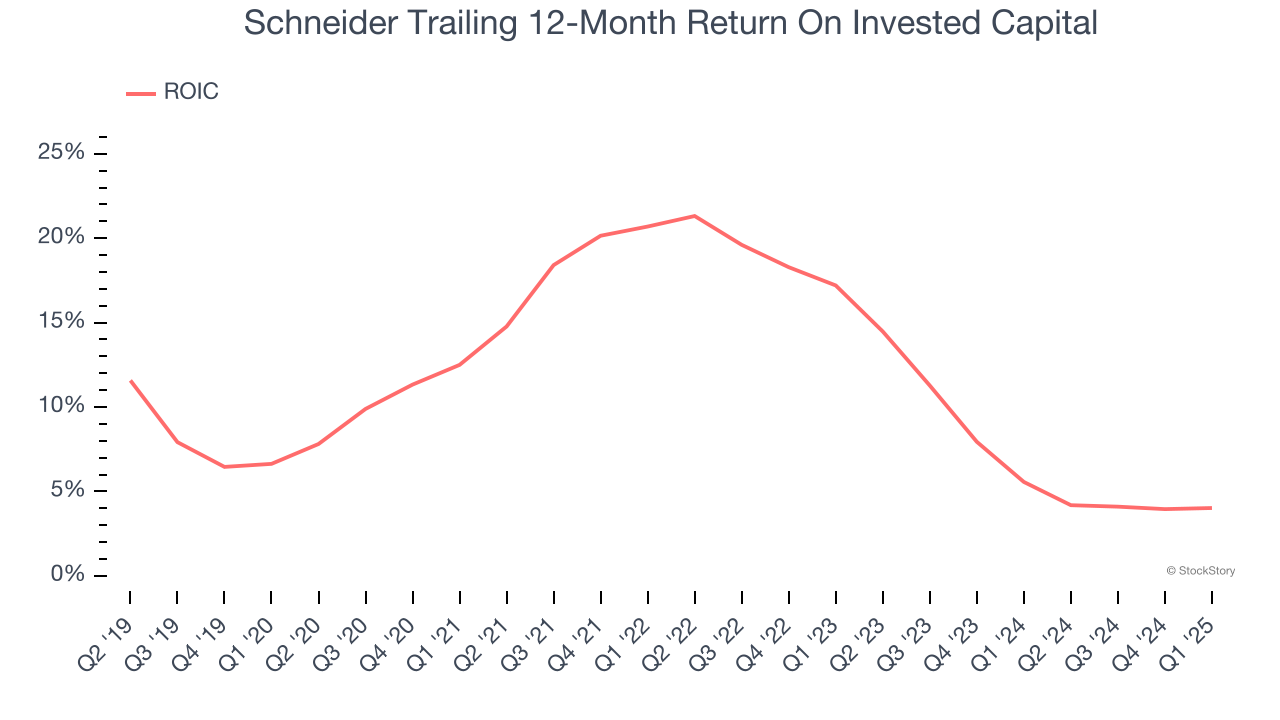
3. New Investments Fail to Bear Fruit as ROIC Declines
A company’s ROIC, or return on invested capital, shows how much operating profit it makes compared to the money it has raised (debt and equity).
We like to invest in businesses with high returns, but the trend in a company’s ROIC is what often surprises the market and moves the stock price. Unfortunately, Schneider’s ROIC has decreased significantly over the last few years. We like what management has done in the past, but its declining returns are perhaps a symptom of fewer profitable growth opportunities.
Final Judgment
Schneider falls short of our quality standards. Following the recent decline, the stock trades at 25.5× forward P/E (or $25.03 per share). This valuation tells us a lot of optimism is priced in - we think there are better stocks to buy right now. We’d suggest looking at the Amazon and PayPal of Latin America.
Stocks We Like More Than Schneider
Donald Trump’s victory in the 2024 U.S. Presidential Election sent major indices to all-time highs, but stocks have retraced as investors debate the health of the economy and the potential impact of tariffs.
While this leaves much uncertainty around 2025, a few companies are poised for long-term gains regardless of the political or macroeconomic climate, like our Top 5 Growth Stocks for this month. This is a curated list of our High Quality stocks that have generated a market-beating return of 183% over the last five years (as of March 31st 2025).
Stocks that made our list in 2020 include now familiar names such as Nvidia (+1,545% between March 2020 and March 2025) as well as under-the-radar businesses like the once-small-cap company Exlservice (+354% five-year return). Find your next big winner with StockStory today.