Since July 2020, the S&P 500 has delivered a total return of 97.8%. But one standout stock has more than doubled the market - over the past five years, Crane has surged 227% to $189.64 per share. Its momentum hasn’t stopped as it’s also gained 25.6% in the last six months thanks to its solid quarterly results, beating the S&P by 20%.
Is there a buying opportunity in Crane, or does it present a risk to your portfolio? Get the full breakdown from our expert analysts, it’s free.
Why Do We Think Crane Will Underperform?
We’re happy investors have made money, but we don't have much confidence in Crane. Here are three reasons why you should be careful with CR and a stock we'd rather own.
1. Slow Organic Growth Suggests Waning Demand In Core Business
In addition to reported revenue, organic revenue is a useful data point for analyzing General Industrial Machinery companies. This metric gives visibility into Crane’s core business because it excludes one-time events such as mergers, acquisitions, and divestitures along with foreign currency fluctuations - non-fundamental factors that can manipulate the income statement.
Over the last two years, Crane’s organic revenue averaged 6.8% year-on-year growth. This performance slightly lagged the sector and suggests it may need to improve its products, pricing, or go-to-market strategy, which can add an extra layer of complexity to its operations. 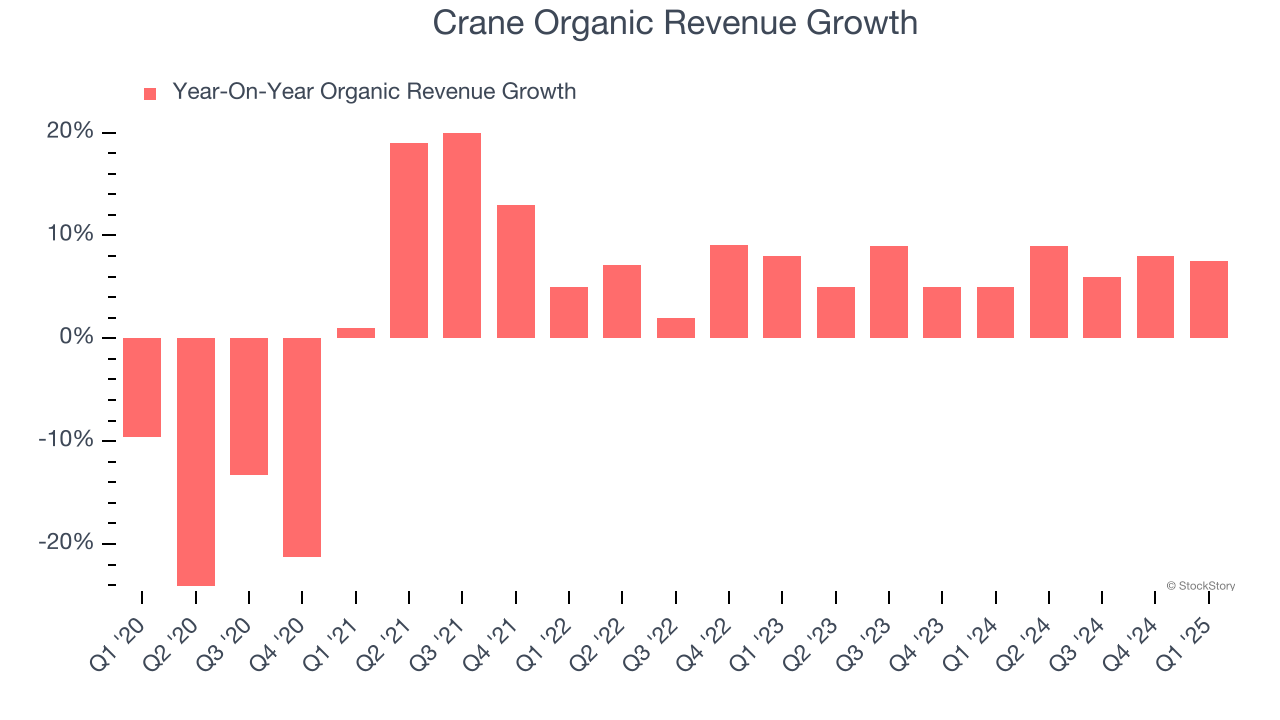
2. Projected Revenue Growth Is Slim
Forecasted revenues by Wall Street analysts signal a company’s potential. Predictions may not always be accurate, but accelerating growth typically boosts valuation multiples and stock prices while slowing growth does the opposite.
Over the next 12 months, sell-side analysts expect Crane’s revenue to rise by 6.3%. Although this projection implies its newer products and services will fuel better top-line performance, it is still below average for the sector.
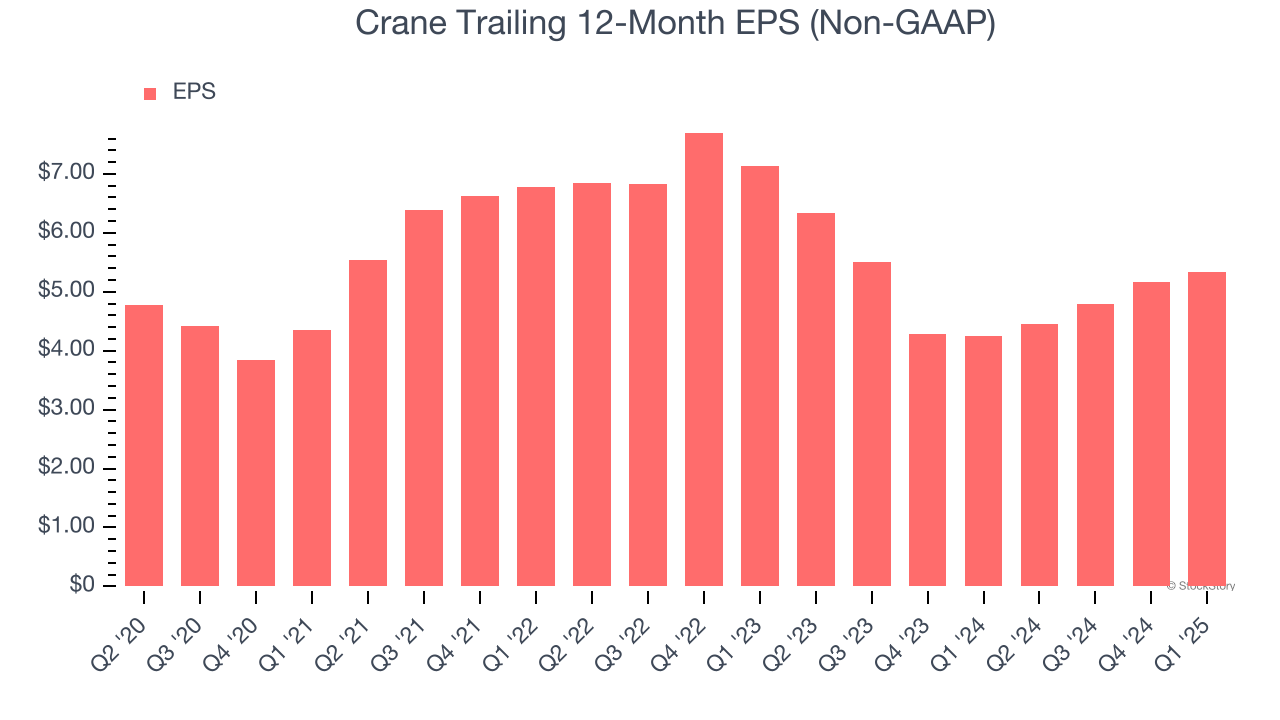
3. EPS Growth Has Stalled
We track the long-term change in earnings per share (EPS) because it highlights whether a company’s growth is profitable.
Crane’s flat EPS over the last five years was weak. On the bright side, this performance was better than its 7.7% annualized revenue declines.
Final Judgment
Crane falls short of our quality standards. With its shares topping the market in recent months, the stock trades at 33.5× forward P/E (or $189.64 per share). This multiple tells us a lot of good news is priced in - you can find more timely opportunities elsewhere. Let us point you toward an all-weather company that owns household favorite Taco Bell.
Stocks We Like More Than Crane
Donald Trump’s victory in the 2024 U.S. Presidential Election sent major indices to all-time highs, but stocks have retraced as investors debate the health of the economy and the potential impact of tariffs.
While this leaves much uncertainty around 2025, a few companies are poised for long-term gains regardless of the political or macroeconomic climate, like our Top 9 Market-Beating Stocks. This is a curated list of our High Quality stocks that have generated a market-beating return of 183% over the last five years (as of March 31st 2025).
Stocks that made our list in 2020 include now familiar names such as Nvidia (+1,545% between March 2020 and March 2025) as well as under-the-radar businesses like the once-micro-cap company Kadant (+351% five-year return). Find your next big winner with StockStory today.