
Quarterly earnings results are a good time to check in on a company’s progress, especially compared to its peers in the same sector. Today we are looking at Semtech (NASDAQ: SMTC) and the best and worst performers in the semiconductor manufacturing industry.
The semiconductor industry is driven by demand for advanced electronic products like smartphones, PCs, servers, and data storage. The need for technologies like artificial intelligence, 5G networks, and smart cars is also creating the next wave of growth for the industry. Keeping up with this dynamism requires new tools that can design, fabricate, and test chips at ever smaller sizes and more complex architectures, creating a dire need for semiconductor capital manufacturing equipment.
The 14 semiconductor manufacturing stocks we track reported a mixed Q1. As a group, revenues missed analysts’ consensus estimates by 0.7% while next quarter’s revenue guidance was 3% below.
Luckily, semiconductor manufacturing stocks have performed well with share prices up 23.7% on average since the latest earnings results.
Semtech (NASDAQ: SMTC)
A public company since the late 1960s, Semtech (NASDAQ: SMTC) is a provider of analog and mixed-signal semiconductors used for Internet of Things systems and cloud connectivity.
Semtech reported revenues of $251.1 million, up 21.8% year on year. This print was in line with analysts’ expectations, and overall, it was a strong quarter for the company with a significant improvement in its inventory levels and a solid beat of analysts’ adjusted operating income estimates.
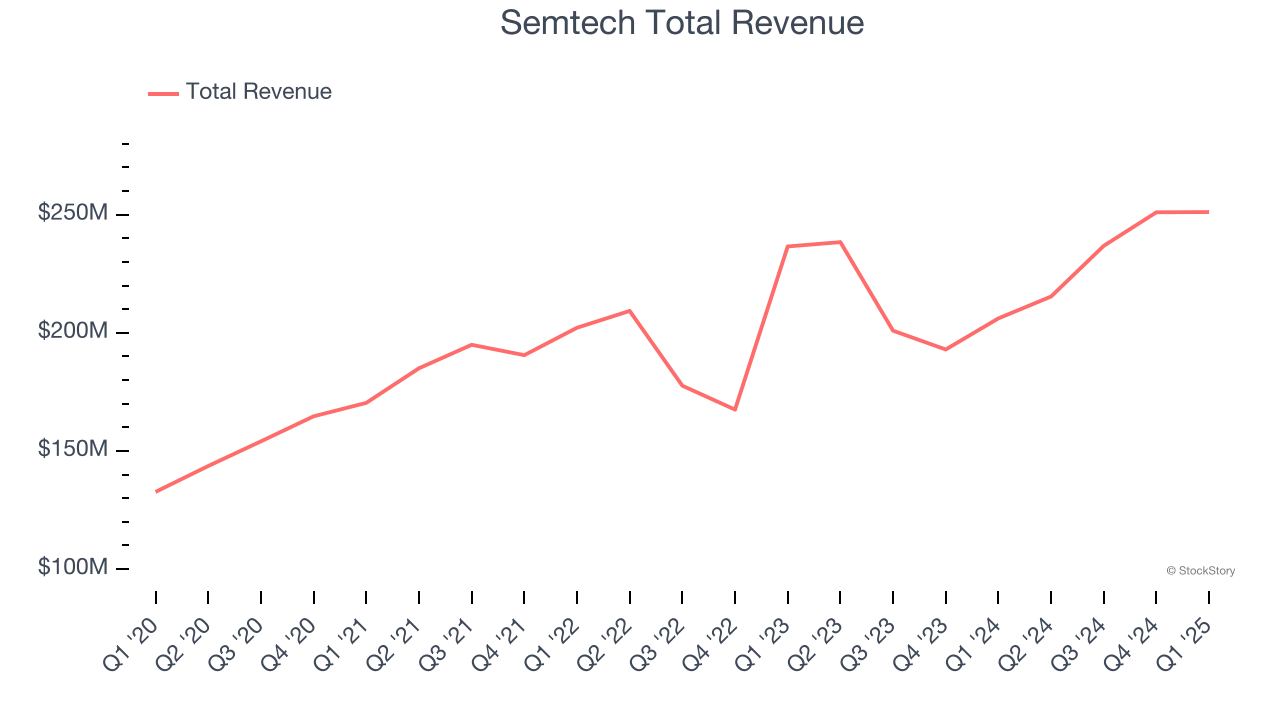
Interestingly, the stock is up 38.9% since reporting and currently trades at $53.90.
Is now the time to buy Semtech? Access our full analysis of the earnings results here, it’s free.
Best Q1: FormFactor (NASDAQ: FORM)
With customers across the foundry and fabless markets, FormFactor (NASDAQ: FORM) is a US-based provider of test and measurement technologies for semiconductors.
FormFactor reported revenues of $171.4 million, up 1.6% year on year, outperforming analysts’ expectations by 0.9%. The business had a strong quarter with a solid beat of analysts’ EPS estimates and an impressive beat of analysts’ adjusted operating income estimates.
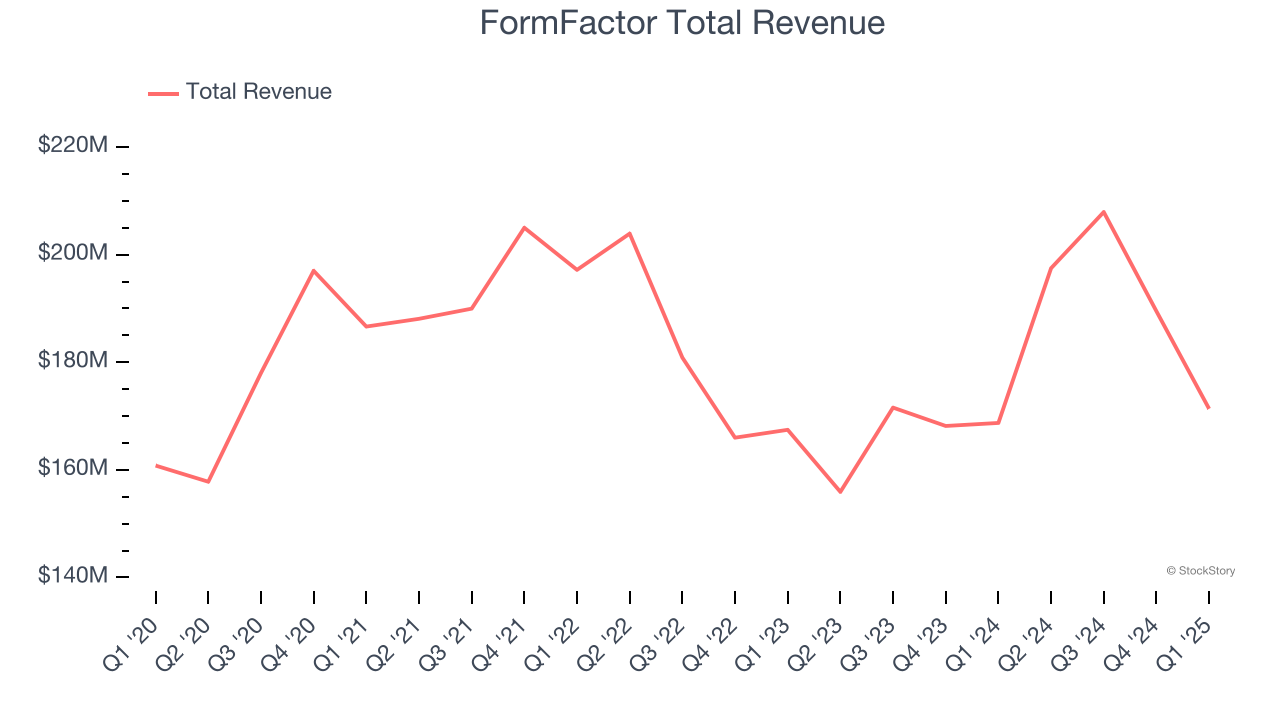
The market seems happy with the results as the stock is up 25.1% since reporting. It currently trades at $35.12.
Is now the time to buy FormFactor? Access our full analysis of the earnings results here, it’s free.
Weakest Q1: Photronics (NASDAQ: PLAB)
Sporting a global footprint of facilities, Photronics (NASDAQ: PLAB) is a manufacturer of photomasks, templates used to transfer patterns onto semiconductor wafers.
Photronics reported revenues of $211 million, down 2.8% year on year, in line with analysts’ expectations. It was a disappointing quarter as it posted revenue guidance for next quarter missing analysts’ expectations and a significant miss of analysts’ EPS estimates.
As expected, the stock is down 4.3% since the results and currently trades at $19.22.
Read our full analysis of Photronics’s results here.
KLA Corporation (NASDAQ: KLAC)
Formed by the 1997 merger of the two leading semiconductor yield management companies, KLA Corporation (NASDAQ: KLAC) is the leading supplier of equipment used to measure and inspect semiconductor chips.
KLA Corporation reported revenues of $3.06 billion, up 29.8% year on year. This result beat analysts’ expectations by 1.8%. It was a strong quarter as it also logged a solid beat of analysts’ adjusted operating income estimates and an impressive beat of analysts’ EPS estimates.
The stock is up 32.6% since reporting and currently trades at $932.24.
Read our full, actionable report on KLA Corporation here, it’s free.
Teradyne (NASDAQ: TER)
Sporting most major chip manufacturers as its customers, Teradyne (NASDAQ: TER) is a US-based supplier of automated test equipment for semiconductors as well as other technologies and devices.
Teradyne reported revenues of $685.7 million, up 14.3% year on year. This number was in line with analysts’ expectations. More broadly, it was a satisfactory quarter as it also produced an impressive beat of analysts’ EPS estimates but an increase in its inventory levels.
The stock is up 22.5% since reporting and currently trades at $94.10.
Read our full, actionable report on Teradyne here, it’s free.
Market Update
Thanks to the Fed’s series of rate hikes in 2022 and 2023, inflation has cooled significantly from its post-pandemic highs, drawing closer to the 2% goal. This disinflation has occurred without severely impacting economic growth, suggesting the success of a soft landing. The stock market thrived in 2024, spurred by recent rate cuts (0.5% in September and 0.25% in November), and a notable surge followed Donald Trump’s presidential election win in November, propelling indices to historic highs. Nonetheless, the outlook for 2025 remains clouded by potential trade policy changes and corporate tax discussions, which could impact business confidence and growth. The path forward holds both optimism and caution as new policies take shape.
Want to invest in winners with rock-solid fundamentals? Check out our Strong Momentum Stocks and add them to your watchlist. These companies are poised for growth regardless of the political or macroeconomic climate.
StockStory is growing and hiring equity analyst and marketing roles. Are you a 0 to 1 builder passionate about the markets and AI? See the open roles here.