
Regional banking company Zions Bancorporation (NASDAQ: ZION) reported Q2 CY2025 results exceeding the market’s revenue expectations, with sales up 8% year on year to $838 million. Its GAAP profit of $1.63 per share was 24.1% above analysts’ consensus estimates.
Is now the time to buy Zions Bancorporation? Find out by accessing our full research report, it’s free.
Zions Bancorporation (ZION) Q2 CY2025 Highlights:
- Net Interest Income: $648 million vs analyst estimates of $644.7 million (8.5% year-on-year growth, 0.5% beat)
- Net Interest Margin: 3.2% vs analyst estimates of 3.1% (19 basis point year-on-year increase, 3.3 bps beat)
- Revenue: $838 million vs analyst estimates of $806.6 million (8% year-on-year growth, 3.9% beat)
- Efficiency Ratio: 62.2% vs analyst estimates of 64.6% (2.4 percentage point beat)
- EPS (GAAP): $1.63 vs analyst estimates of $1.31 (24.1% beat)
- Market Capitalization: $8.38 billion
Company Overview
Founded in 1873 during Utah's pioneer era and named after Mount Zion in the Bible, Zions Bancorporation (NASDAQ: ZION) operates seven regional banks across the Western United States, providing commercial, retail, and wealth management services to over a million customers.
Sales Growth
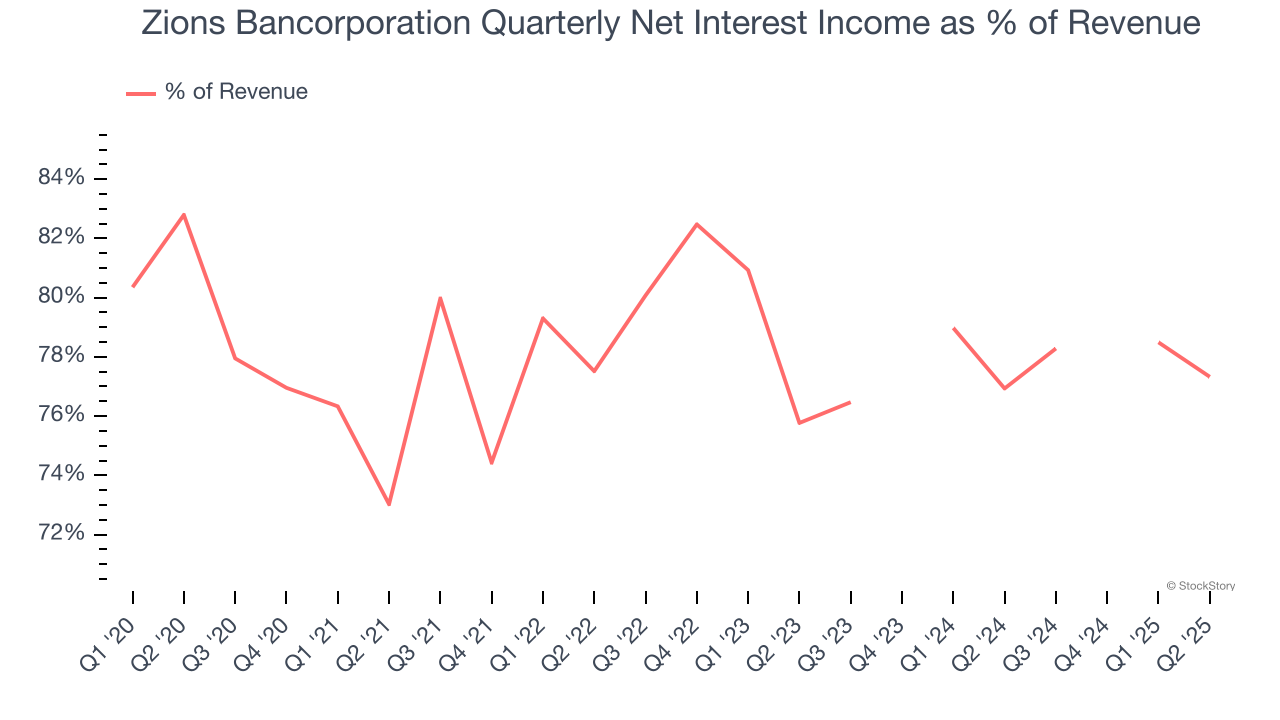
In general, banks make money from two primary sources. The first is net interest income, which is interest earned on loans, mortgages, and investments in securities minus interest paid out on deposits. The second source is non-interest income, which can come from bank account, credit card, wealth management, investing banking, and trading fees.
Unfortunately, Zions Bancorporation’s 3.1% annualized revenue growth over the last five years was mediocre. This fell short of our benchmark for the bank sector and is a poor baseline for our analysis.
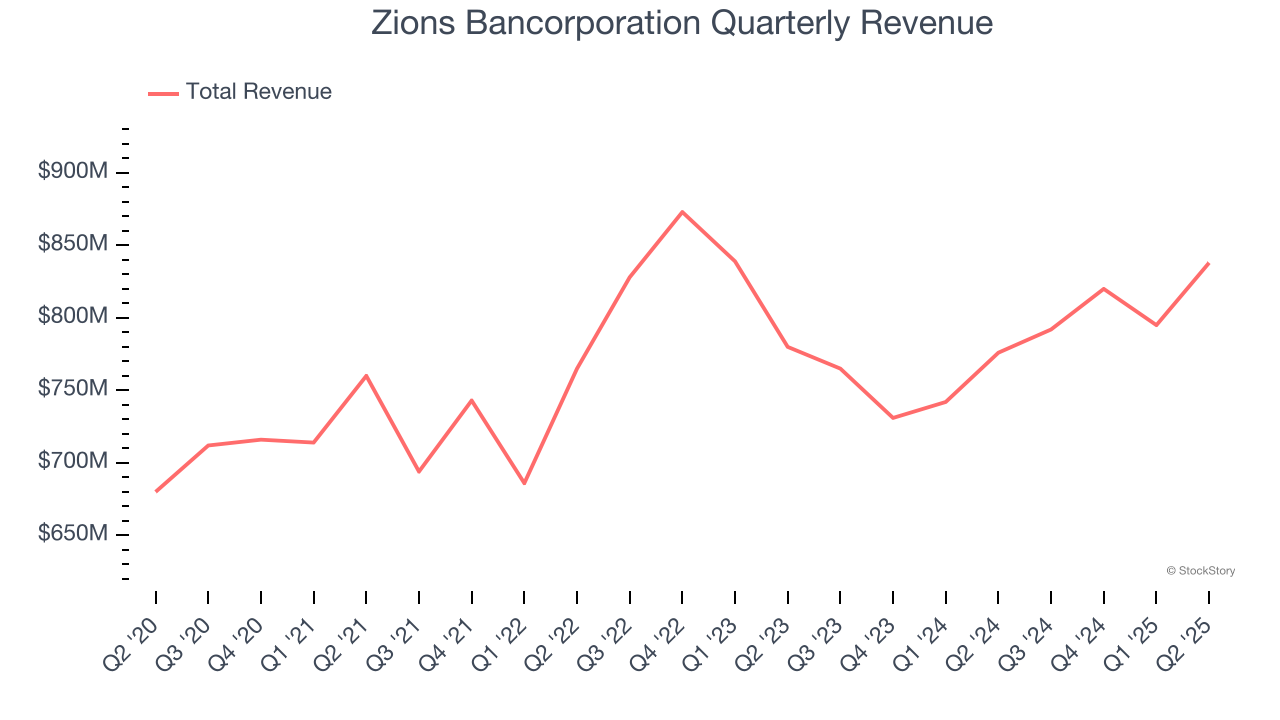
We at StockStory place the most emphasis on long-term growth, but within financials, a half-decade historical view may miss recent interest rate changes, market returns, and industry trends. Zions Bancorporation’s performance shows it grew in the past but relinquished its gains over the last two years, as its revenue fell by 1.1% annually. 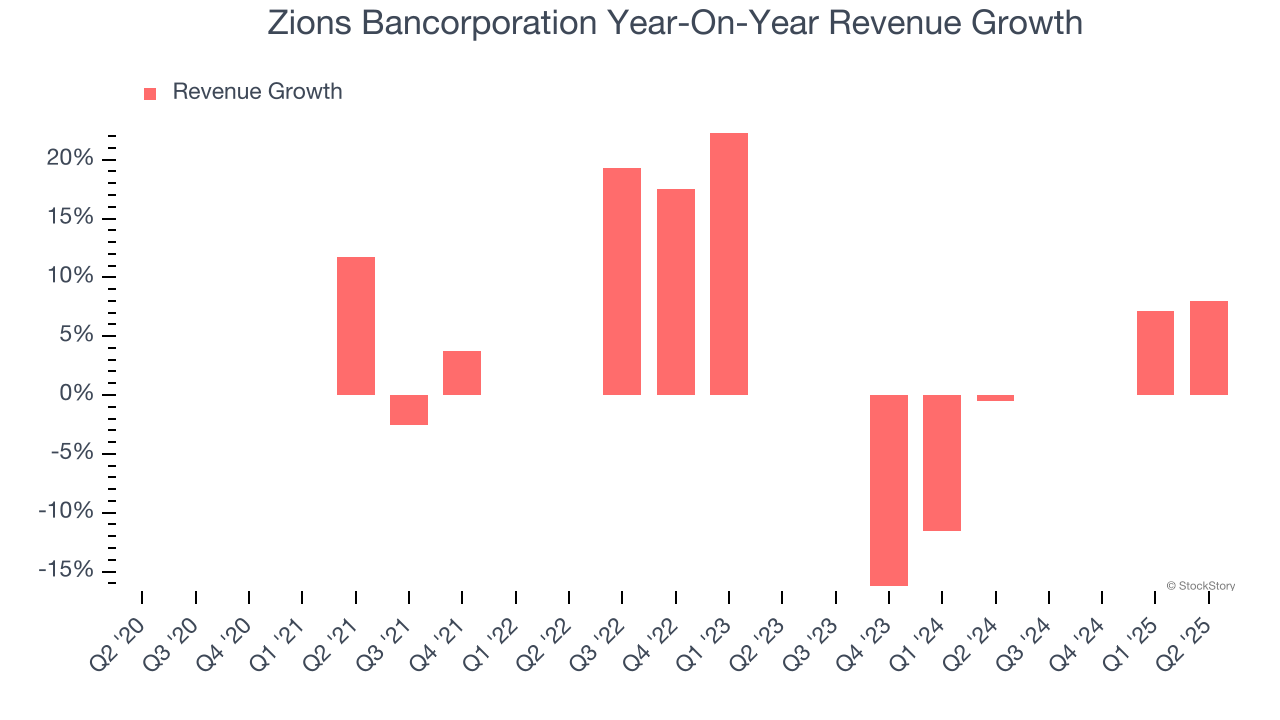 Note: Quarters not shown were determined to be outliers, impacted by outsized investment gains/losses that are not indicative of the recurring fundamentals of the business.
This quarter, Zions Bancorporation reported year-on-year revenue growth of 8%, and its $838 million of revenue exceeded Wall Street’s estimates by 3.9%.
Since the company recorded losses on certain securities, it generated more net interest income than revenue during the last five years, meaning Zions Bancorporation lives and dies by its lending activities because non-interest income barely moves the needle.
 Note: Quarters not shown were determined to be outliers, impacted by outsized investment gains/losses that are not indicative of the recurring fundamentals of the business.
Markets consistently prioritize net interest income growth over fee-based revenue, recognizing its superior quality and recurring nature compared to the more unpredictable non-interest income streams.
Today’s young investors won’t have read the timeless lessons in Gorilla Game: Picking Winners In High Technology because it was written more than 20 years ago when Microsoft and Apple were first establishing their supremacy. But if we apply the same principles, then enterprise software stocks leveraging their own generative AI capabilities may well be the Gorillas of the future. So, in that spirit, we are excited to present our Special Free Report on a profitable, fast-growing enterprise software stock that is already riding the automation wave and looking to catch the generative AI next.
Tangible Book Value Per Share (TBVPS)
Banks are balance sheet-driven businesses because they generate earnings primarily through borrowing and lending. They’re also valued based on their balance sheet strength and ability to compound book value (another name for shareholders’ equity) over time.
This is why we consider tangible book value per share (TBVPS) the most important metric to track for banks. TBVPS represents the real, liquid net worth per share of a bank, excluding intangible assets that have debatable value upon liquidation. Other (and more commonly known) per-share metrics like EPS can sometimes be murky due to M&A or accounting rules allowing for loan losses to be spread out.
Zions Bancorporation’s TBVPS was flat over the last five years. However, TBVPS growth has accelerated recently, growing by 20.1% annually over the last two years from $25.52 to $36.81 per share.
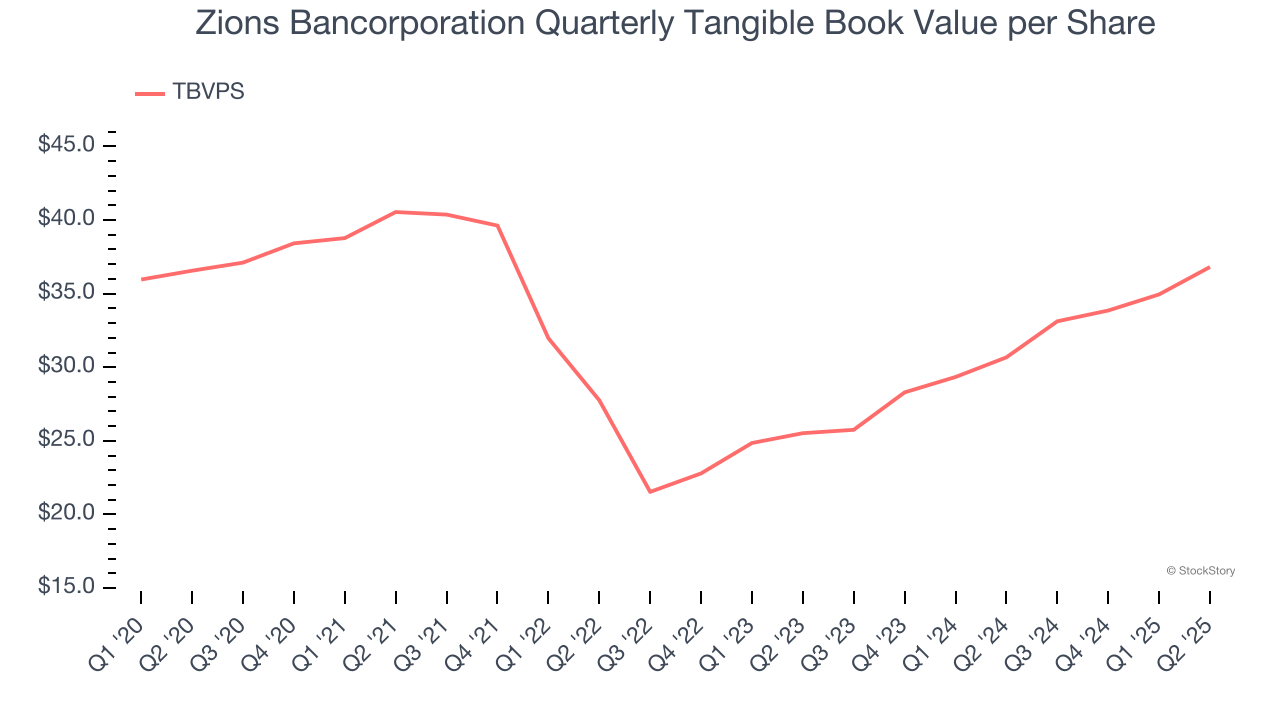
Over the next 12 months, Consensus estimates call for Zions Bancorporation’s TBVPS to grow by 11.6% to $41.08, top-notch growth rate.
Key Takeaways from Zions Bancorporation’s Q2 Results
We were impressed by how Zions Bancorporation beat analysts’ expectations across every key metric. Zooming out, we think this was a good print. The stock traded up 2% to $57.75 immediately following the results.
Indeed, Zions Bancorporation had a rock-solid quarterly earnings result, but is this stock a good investment here? When making that decision, it’s important to consider its valuation, business qualities, as well as what has happened in the latest quarter. We cover that in our actionable full research report which you can read here, it’s free.


