
Regional banking company City Holding (NASDAQ: CHCO) reported Q2 CY2025 results beating Wall Street’s revenue expectations, with sales up 6.3% year on year to $78.16 million. Its GAAP profit of $2.29 per share was 17% above analysts’ consensus estimates.
Is now the time to buy City Holding? Find out by accessing our full research report, it’s free.
City Holding (CHCO) Q2 CY2025 Highlights:
- Net Interest Income: $59.12 million vs analyst estimates of $56.73 million (8.2% year-on-year growth, 4.2% beat)
- Net Interest Margin: 4% vs analyst estimates of 3.8% (8 basis point year-on-year increase, 13.2 bps beat)
- Revenue: $78.16 million vs analyst estimates of $75.87 million (6.3% year-on-year growth, 3% beat)
- Efficiency Ratio: 49% vs analyst estimates of 50.8% (1.8 percentage point beat)
- EPS (GAAP): $2.29 vs analyst estimates of $1.96 (17% beat)
- Market Capitalization: $1.80 billion
Company Overview
With roots dating back to 1957 and a strategic presence along the I-64 and I-81 corridors, City Holding (NASDAQGS:CHCO) operates as a financial holding company providing banking, trust, and investment services through its subsidiary City National Bank across West Virginia, Kentucky, Virginia, and Ohio.
Sales Growth
Two primary revenue streams drive bank earnings. While net interest income, which is earned by charging higher rates on loans than paid on deposits, forms the foundation, fee-based services across banking, credit, wealth management, and trading operations provide additional income.
Unfortunately, City Holding’s 4.5% annualized revenue growth over the last five years was mediocre. This wasn’t a great result compared to the rest of the bank sector, but there are still things to like about City Holding.
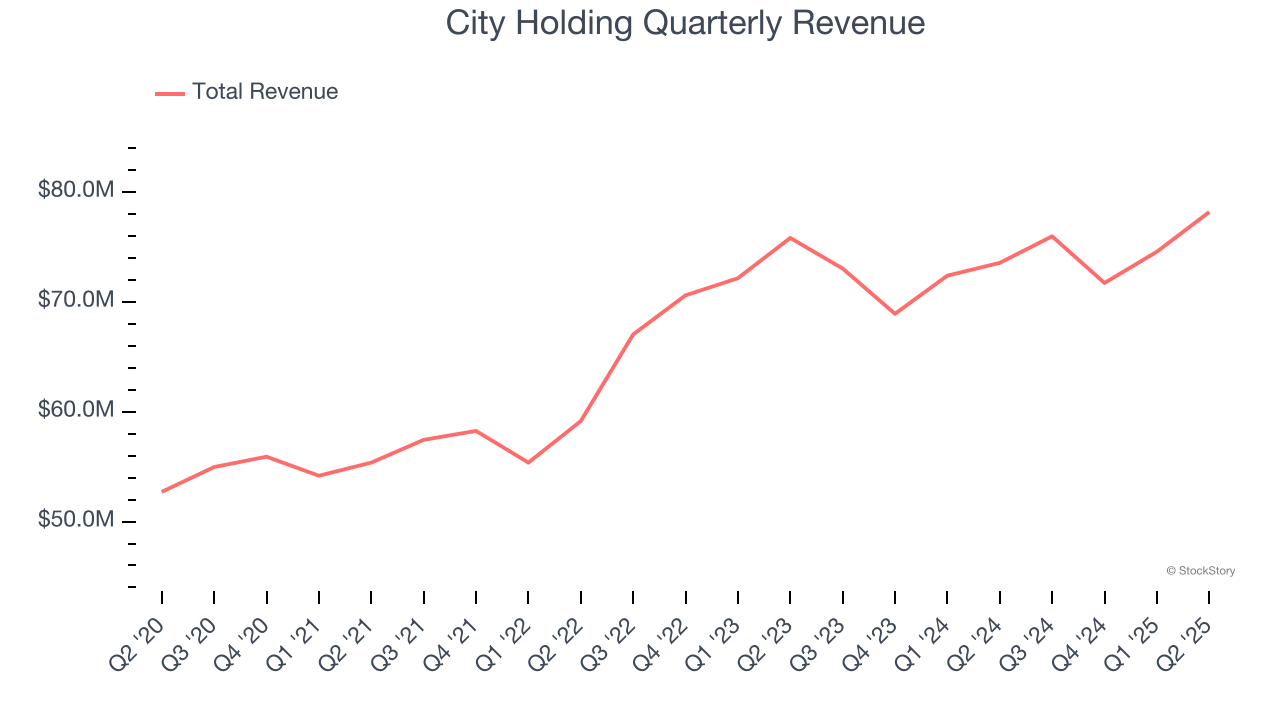
We at StockStory place the most emphasis on long-term growth, but within financials, a half-decade historical view may miss recent interest rate changes, market returns, and industry trends. City Holding’s recent performance shows its demand has slowed as its annualized revenue growth of 2.6% over the last two years was below its five-year trend. 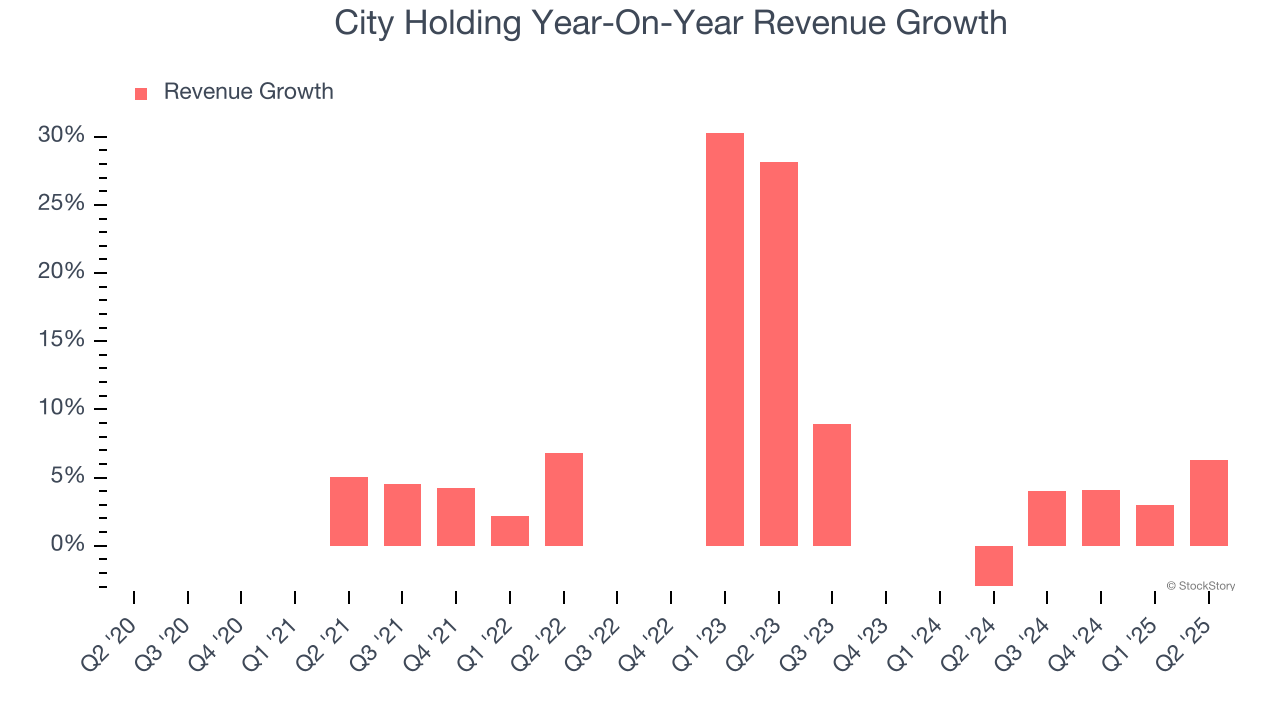 Note: Quarters not shown were determined to be outliers, impacted by outsized investment gains/losses that are not indicative of the recurring fundamentals of the business.
This quarter, City Holding reported year-on-year revenue growth of 6.3%, and its $78.16 million of revenue exceeded Wall Street’s estimates by 3%.
Net interest income made up 72.6% of the company’s total revenue during the last five years, meaning lending operations are City Holding’s largest source of revenue.
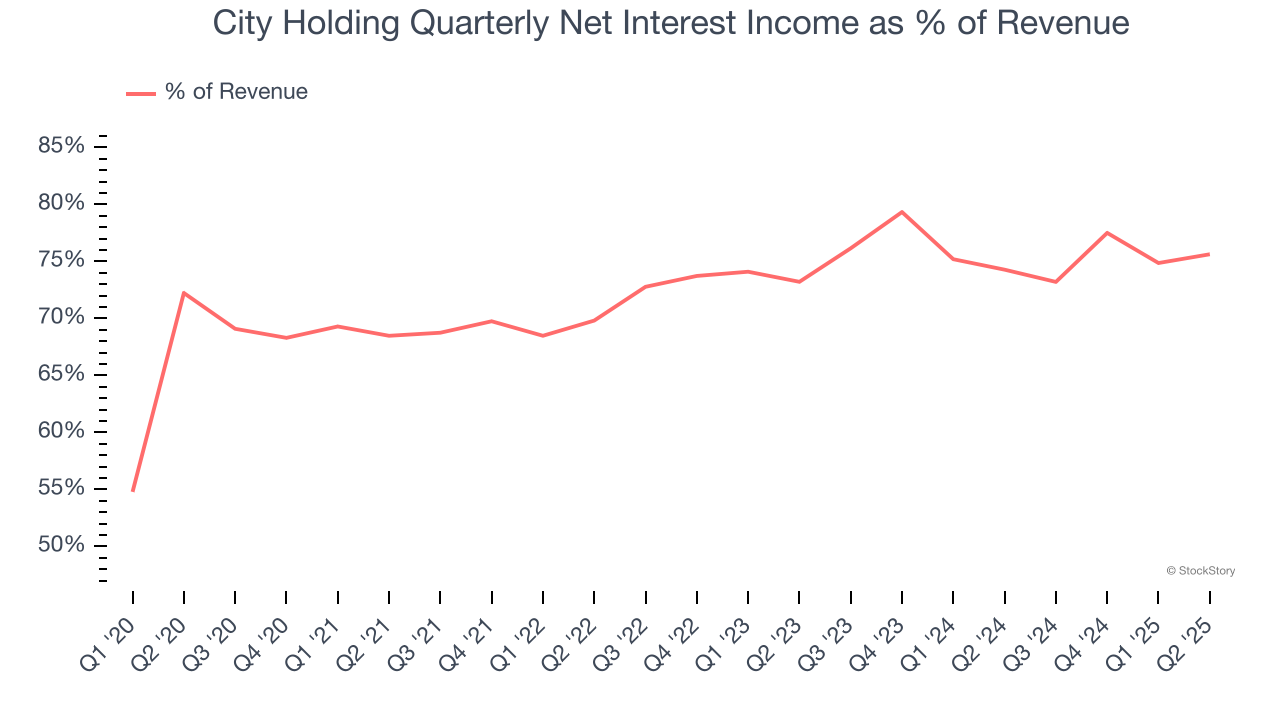
Our experience and research show the market cares primarily about a bank’s net interest income growth as non-interest income is considered a lower-quality and non-recurring revenue source.
Software is eating the world and there is virtually no industry left that has been untouched by it. That drives increasing demand for tools helping software developers do their jobs, whether it be monitoring critical cloud infrastructure, integrating audio and video functionality, or ensuring smooth content streaming. Click here to access a free report on our 3 favorite stocks to play this generational megatrend.
Tangible Book Value Per Share (TBVPS)
The balance sheet drives banking profitability since earnings flow from the spread between borrowing and lending rates. As such, valuations for these companies concentrate on capital strength and sustainable equity accumulation potential.
When analyzing banks, tangible book value per share (TBVPS) takes precedence over many other metrics. This measure isolates genuine per-share value by removing intangible assets of debatable liquidation worth. On the other hand, EPS is often distorted by mergers and flexible loan loss accounting. TBVPS provides clearer performance insights.
City Holding’s TBVPS grew at a tepid 3.2% annual clip over the last five years. However, TBVPS growth has accelerated recently, growing by 15.1% annually over the last two years from $31.50 to $41.76 per share.
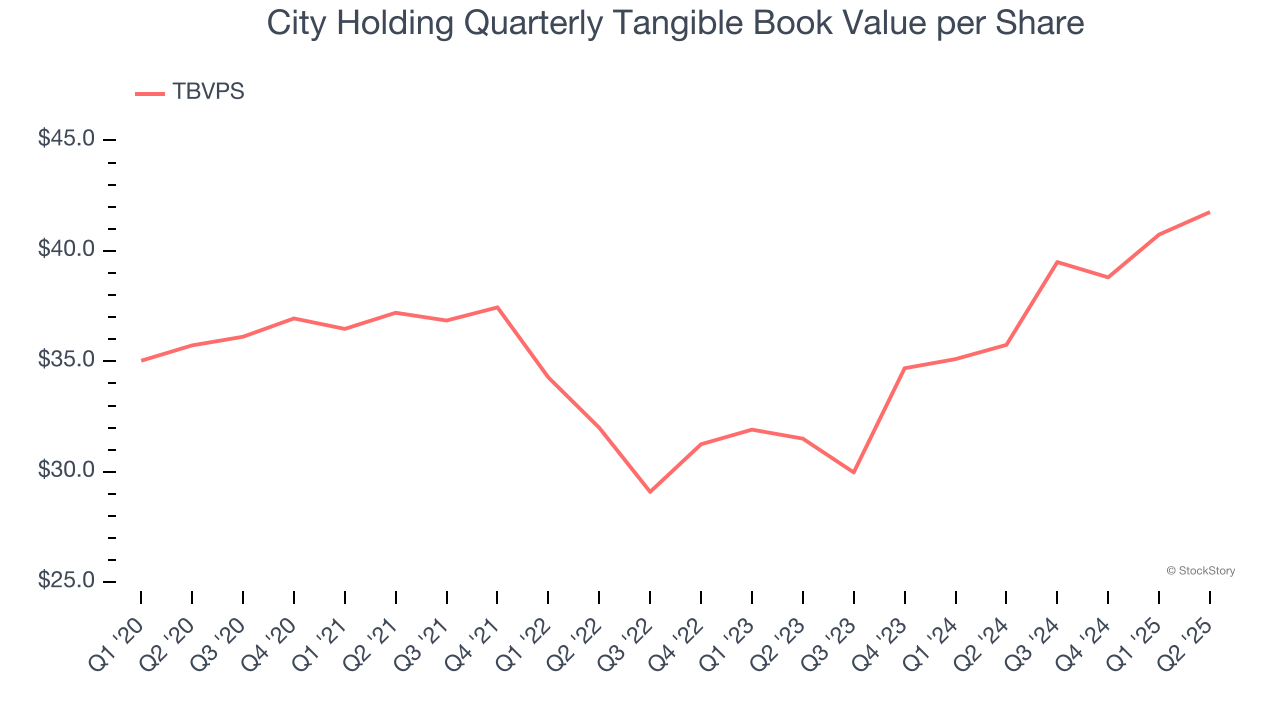
Over the next 12 months, Consensus estimates call for City Holding’s TBVPS to grow by 9% to $45.52, decent growth rate.
Key Takeaways from City Holding’s Q2 Results
We enjoyed seeing City Holding beat analysts’ net interest income expectations this quarter. We were also glad its EPS outperformed Wall Street’s estimates. Zooming out, we think this quarter featured some important positives. The stock remained flat at $128.77 immediately after reporting.
Should you buy the stock or not? What happened in the latest quarter matters, but not as much as longer-term business quality and valuation, when deciding whether to invest in this stock. We cover that in our actionable full research report which you can read here, it’s free.