Home energy technology company Enphase (NASDAQ: ENPH) reported revenue ahead of Wall Street’s expectations in Q2 CY2025, with sales up 19.7% year on year to $363.2 million. On the other hand, next quarter’s revenue guidance of $350 million was less impressive, coming in 5.4% below analysts’ estimates. Its non-GAAP profit of $0.69 per share was 10.8% above analysts’ consensus estimates.
Is now the time to buy Enphase? Find out by accessing our full research report, it’s free.
Enphase (ENPH) Q2 CY2025 Highlights:
- Revenue: $363.2 million vs analyst estimates of $358.5 million (19.7% year-on-year growth, 1.3% beat)
- Adjusted EPS: $0.69 vs analyst estimates of $0.62 (10.8% beat)
- Adjusted EBITDA: $111 million vs analyst estimates of $100.6 million (30.6% margin, 10.3% beat)
- Revenue Guidance for Q3 CY2025 is $350 million at the midpoint, below analyst estimates of $369.9 million
- Operating Margin: 10.2%, up from 0.6% in the same quarter last year
- Free Cash Flow Margin: 5.1%, down from 38.7% in the same quarter last year
- Sales Volumes were flat year on year (-73% in the same quarter last year)
- Market Capitalization: $5.20 billion
Company Overview
The first company to successfully commercialize the solar micro-inverter, Enphase (NASDAQ: ENPH) manufactures software-driven home energy products.
Revenue Growth
Examining a company’s long-term performance can provide clues about its quality. Any business can experience short-term success, but top-performing ones enjoy sustained growth for years. Thankfully, Enphase’s 15.5% annualized revenue growth over the last five years was incredible. Its growth beat the average industrials company and shows its offerings resonate with customers.
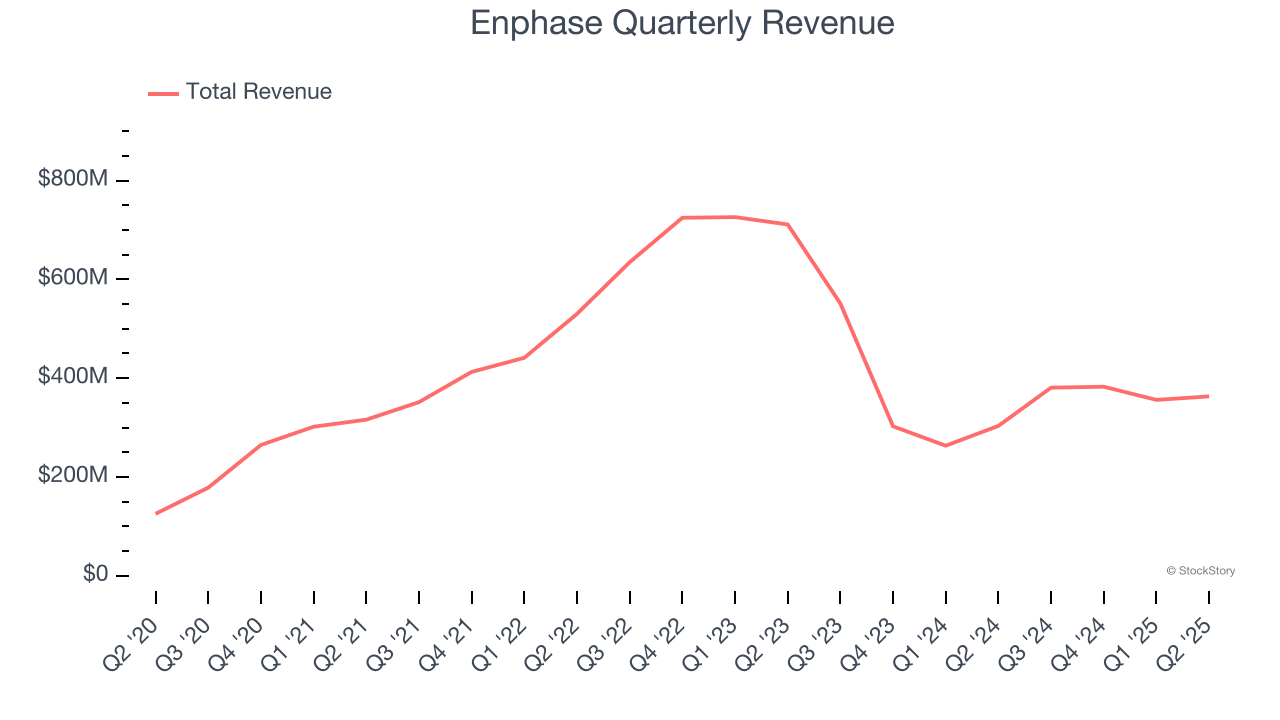
We at StockStory place the most emphasis on long-term growth, but within industrials, a half-decade historical view may miss cycles, industry trends, or a company capitalizing on catalysts such as a new contract win or a successful product line. Enphase’s recent performance marks a sharp pivot from its five-year trend as its revenue has shown annualized declines of 27.2% over the last two years. Enphase isn’t alone in its struggles as the Renewable Energy industry experienced a cyclical downturn, with many similar businesses observing lower sales at this time. 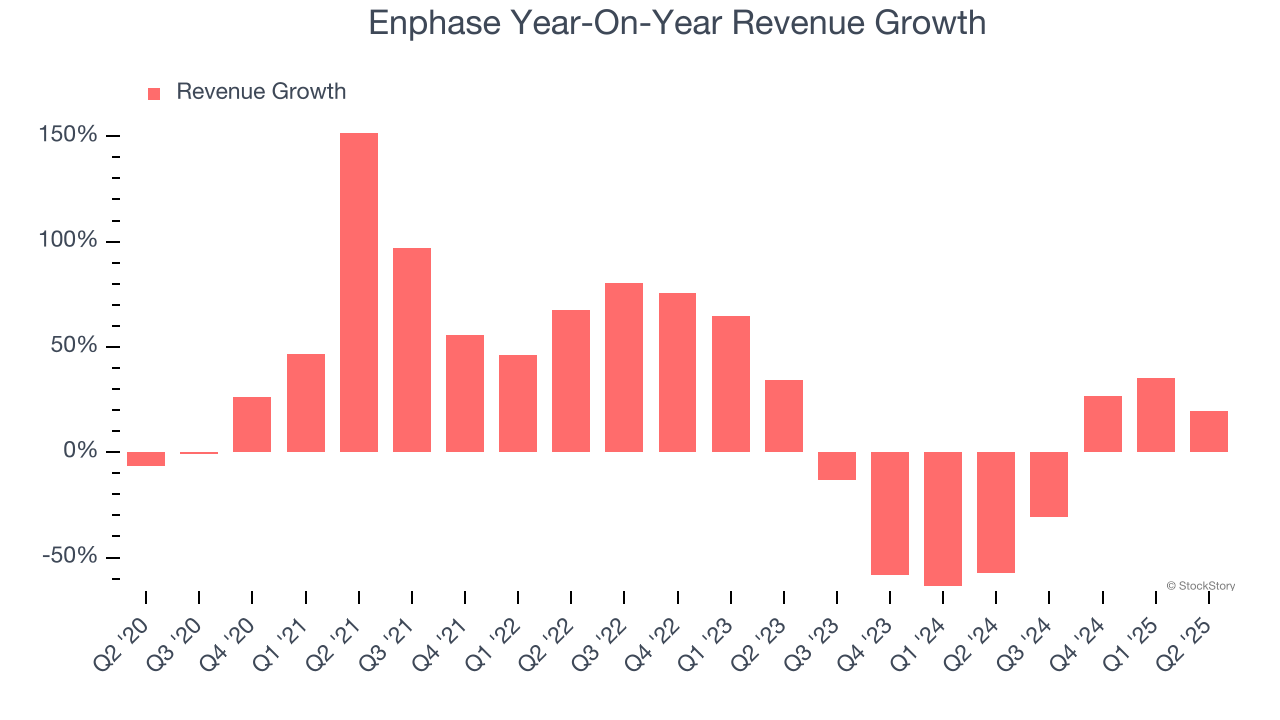
We can better understand the company’s revenue dynamics by analyzing its number of units sold, which reached 1.41 million in the latest quarter. Over the last two years, Enphase’s units sold averaged 30% year-on-year declines. Because this number is lower than its revenue growth, we can see the company benefited from price increases. 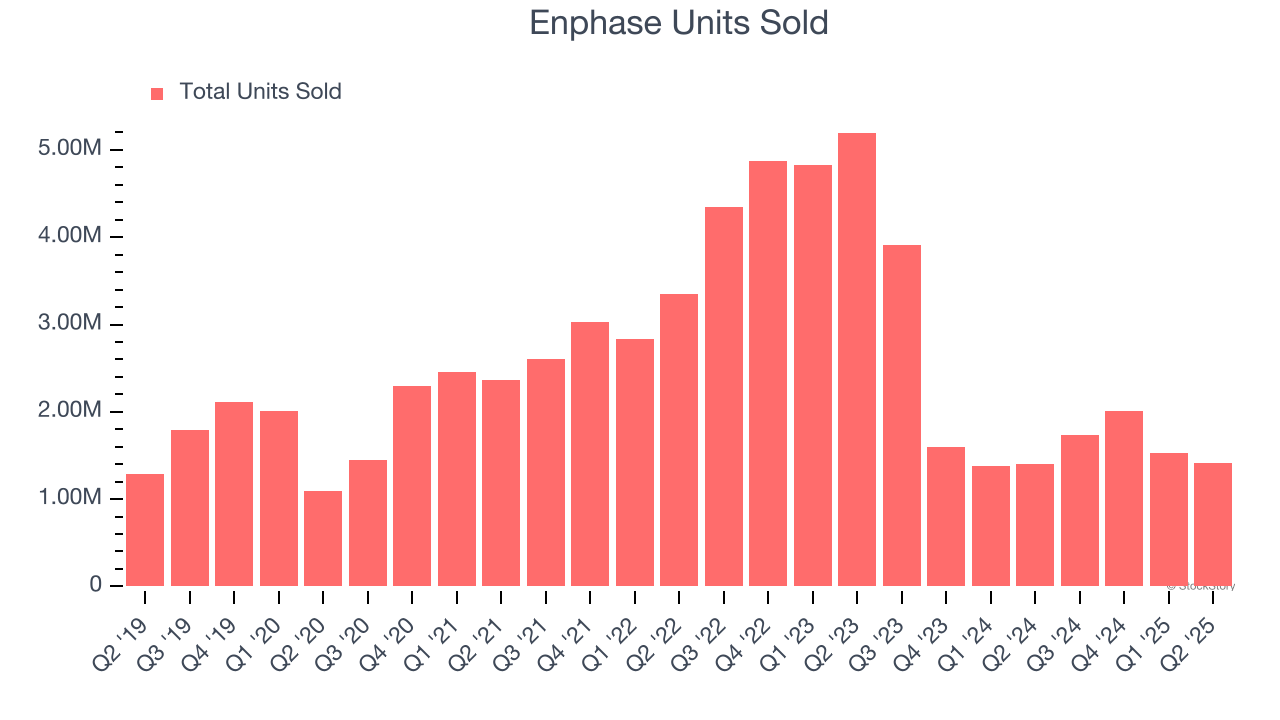
This quarter, Enphase reported year-on-year revenue growth of 19.7%, and its $363.2 million of revenue exceeded Wall Street’s estimates by 1.3%. Company management is currently guiding for a 8.1% year-on-year decline in sales next quarter.
Looking further ahead, sell-side analysts expect revenue to decline by 3% over the next 12 months. While this projection is better than its two-year trend, it’s hard to get excited about a company that is struggling with demand.
Software is eating the world and there is virtually no industry left that has been untouched by it. That drives increasing demand for tools helping software developers do their jobs, whether it be monitoring critical cloud infrastructure, integrating audio and video functionality, or ensuring smooth content streaming. Click here to access a free report on our 3 favorite stocks to play this generational megatrend.
Operating Margin
Operating margin is one of the best measures of profitability because it tells us how much money a company takes home after procuring and manufacturing its products, marketing and selling those products, and most importantly, keeping them relevant through research and development.
Enphase has been a well-oiled machine over the last five years. It demonstrated elite profitability for an industrials business, boasting an average operating margin of 16.3%. This result isn’t surprising as its high gross margin gives it a favorable starting point.
Analyzing the trend in its profitability, Enphase’s operating margin decreased by 12 percentage points over the last five years. This raises questions about the company’s expense base because its revenue growth should have given it leverage on its fixed costs, resulting in better economies of scale and profitability.
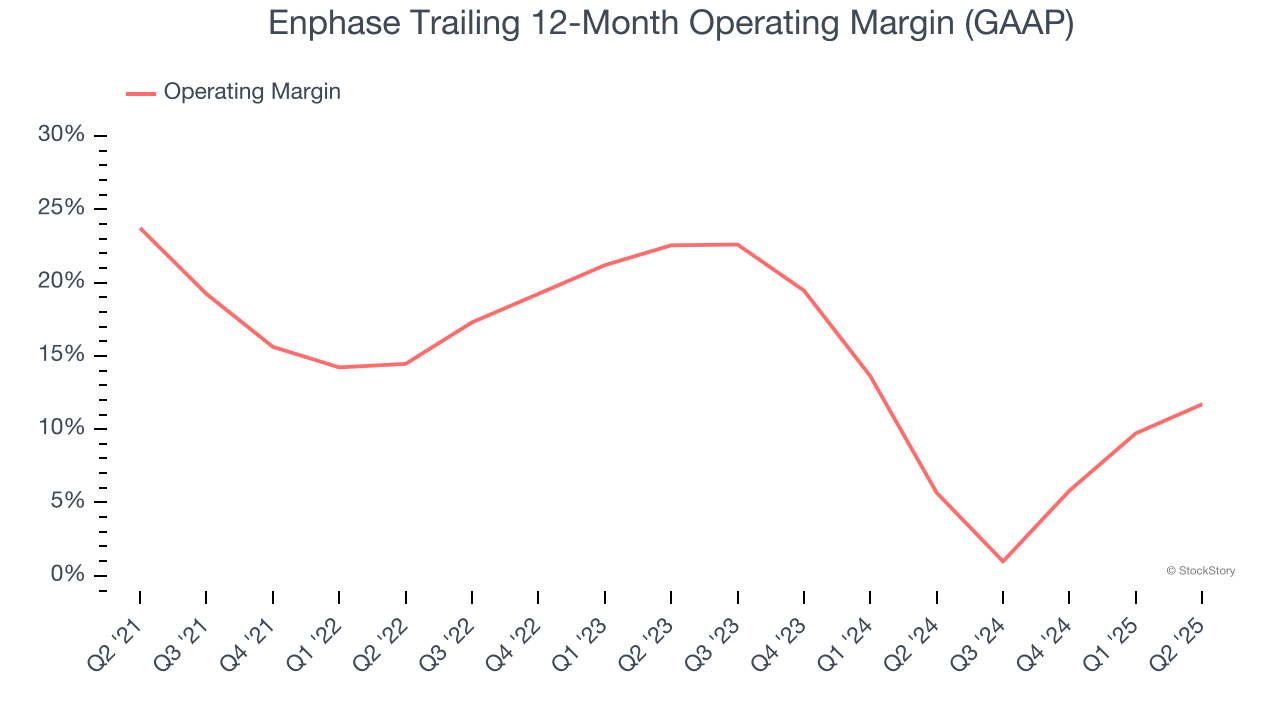
In Q2, Enphase generated an operating margin profit margin of 10.2%, up 9.6 percentage points year on year. The increase was driven by stronger leverage on its cost of sales (not higher efficiency with its operating expenses), as indicated by its larger rise in gross margin.
Earnings Per Share
Revenue trends explain a company’s historical growth, but the long-term change in earnings per share (EPS) points to the profitability of that growth – for example, a company could inflate its sales through excessive spending on advertising and promotions.
Enphase’s EPS grew at an astounding 18.8% compounded annual growth rate over the last five years, higher than its 15.5% annualized revenue growth. This tells us the company became more profitable on a per-share basis as it expanded.
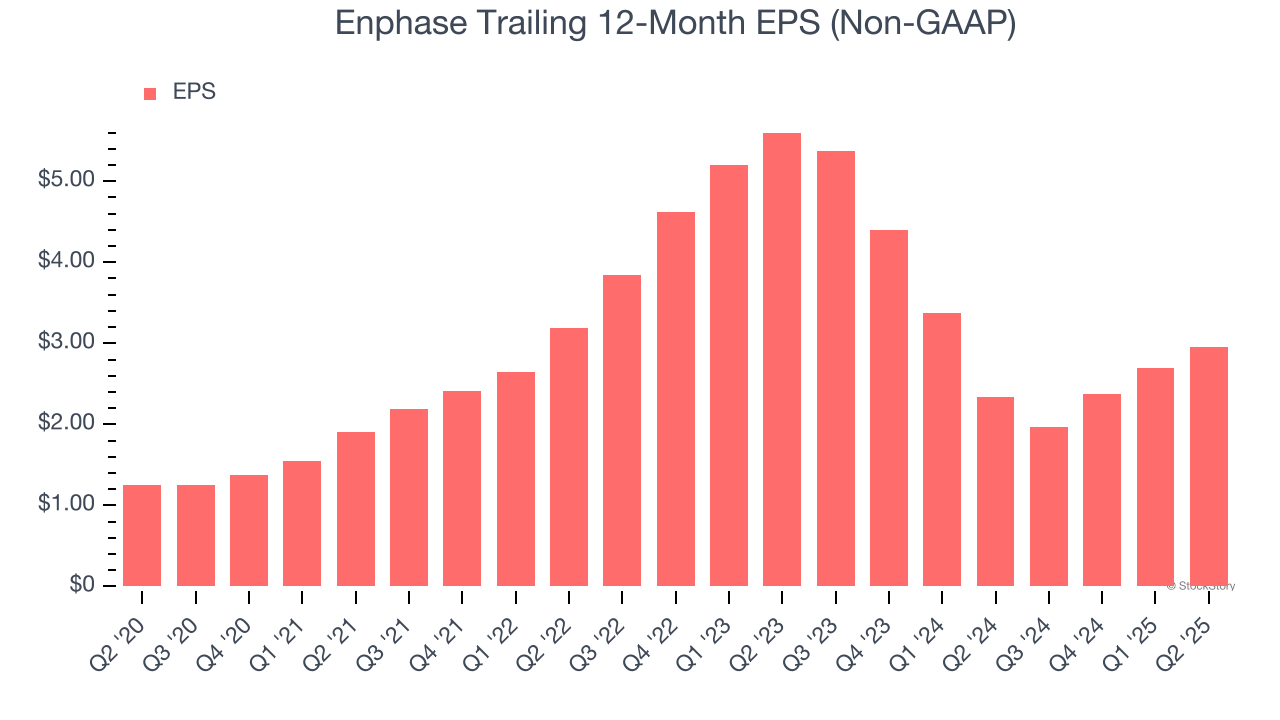
Like with revenue, we analyze EPS over a shorter period to see if we are missing a change in the business.
For Enphase, its two-year annual EPS declines of 27.3% mark a reversal from its (seemingly) healthy five-year trend. We hope Enphase can return to earnings growth in the future.
In Q2, Enphase reported EPS at $0.69, up from $0.43 in the same quarter last year. This print easily cleared analysts’ estimates, and shareholders should be content with the results. Over the next 12 months, Wall Street expects Enphase’s full-year EPS of $2.96 to shrink by 16%.
Key Takeaways from Enphase’s Q2 Results
We were happy that Enphase's EPS outperformed Wall Street’s estimates. On the other hand, its revenue guidance for next quarter missed and its sales volume fell short of Wall Street’s estimates. Overall, this was a weaker quarter. The stock traded down 5.9% to $39.99 immediately after reporting.
Enphase’s latest earnings report disappointed. One quarter doesn’t define a company’s quality, so let’s explore whether the stock is a buy at the current price. If you’re making that decision, you should consider the bigger picture of valuation, business qualities, as well as the latest earnings. We cover that in our actionable full research report which you can read here, it’s free.