Regional banking company National Bank Holdings (NYSE: NBHC) missed Wall Street’s revenue expectations in Q2 CY2025 as sales rose 4% year on year to $104.5 million. Its GAAP profit of $0.88 per share was 11.4% above analysts’ consensus estimates.
Is now the time to buy National Bank Holdings? Find out by accessing our full research report, it’s free.
National Bank Holdings (NBHC) Q2 CY2025 Highlights:
- Net Interest Income: $87.41 million vs analyst estimates of $91.74 million (4.6% year-on-year growth, 4.7% miss)
- Net Interest Margin: 3.9% vs analyst estimates of 4% (10 basis point year-on-year increase, 10.2 bps miss)
- Revenue: $104.5 million vs analyst estimates of $106.9 million (4% year-on-year growth, 2.3% miss)
- Efficiency Ratio: 60.2% vs analyst estimates of 61.3% (1.1 percentage point beat)
- EPS (GAAP): $0.88 vs analyst estimates of $0.79 (11.4% beat)
- Market Capitalization: $1.51 billion
Company Overview
Operating under familiar local brands like Community Banks of Colorado, Bank Midwest, and Bank of Jackson Hole, National Bank Holdings (NYSE: NBHC) operates regional banks across Colorado, Kansas, Missouri, Wyoming, Texas, and other western states, offering commercial, business, and consumer banking services.
Sales Growth
From lending activities to service fees, most banks build their revenue model around two income sources. Interest rate spreads between loans and deposits create the first stream, with the second coming from charges on everything from basic bank accounts to complex investment banking transactions.
Luckily, National Bank Holdings’s revenue grew at a decent 6.4% compounded annual growth rate over the last five years. Its growth was slightly above the average bank company and shows its offerings resonate with customers.
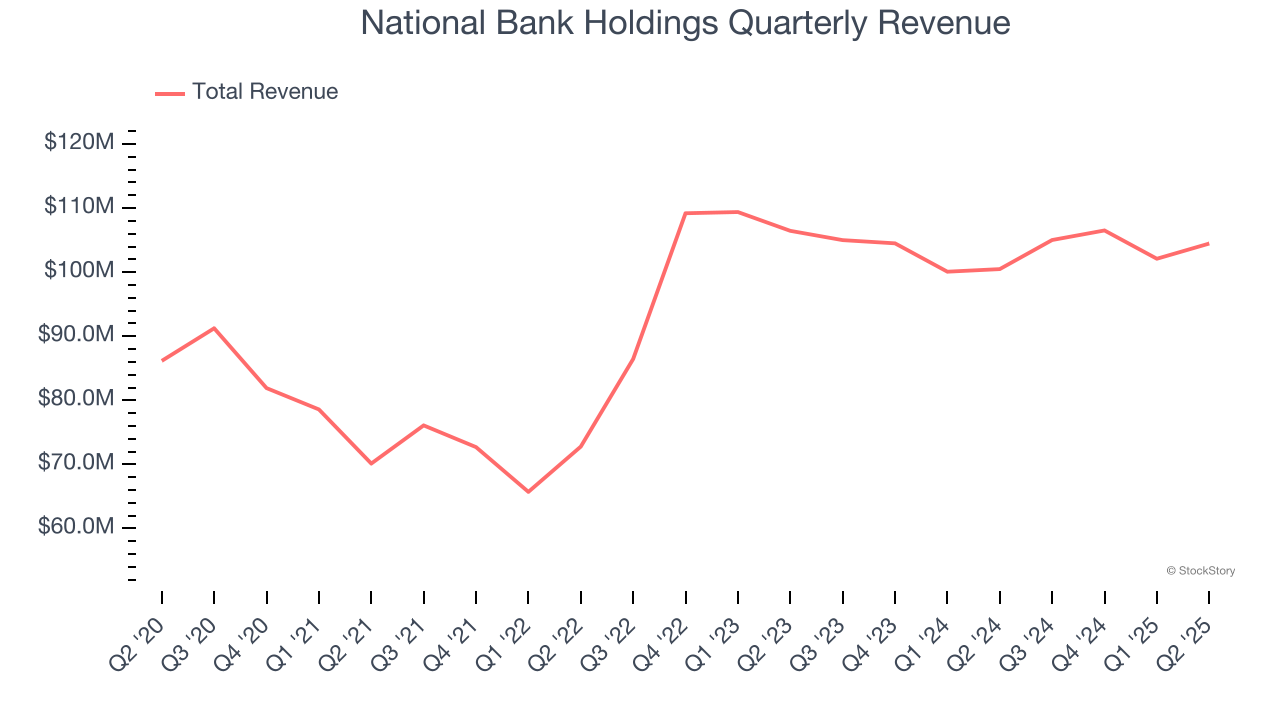
We at StockStory place the most emphasis on long-term growth, but within financials, a half-decade historical view may miss recent interest rate changes, market returns, and industry trends. National Bank Holdings’s recent performance shows its demand has slowed as its revenue was flat over the last two years. 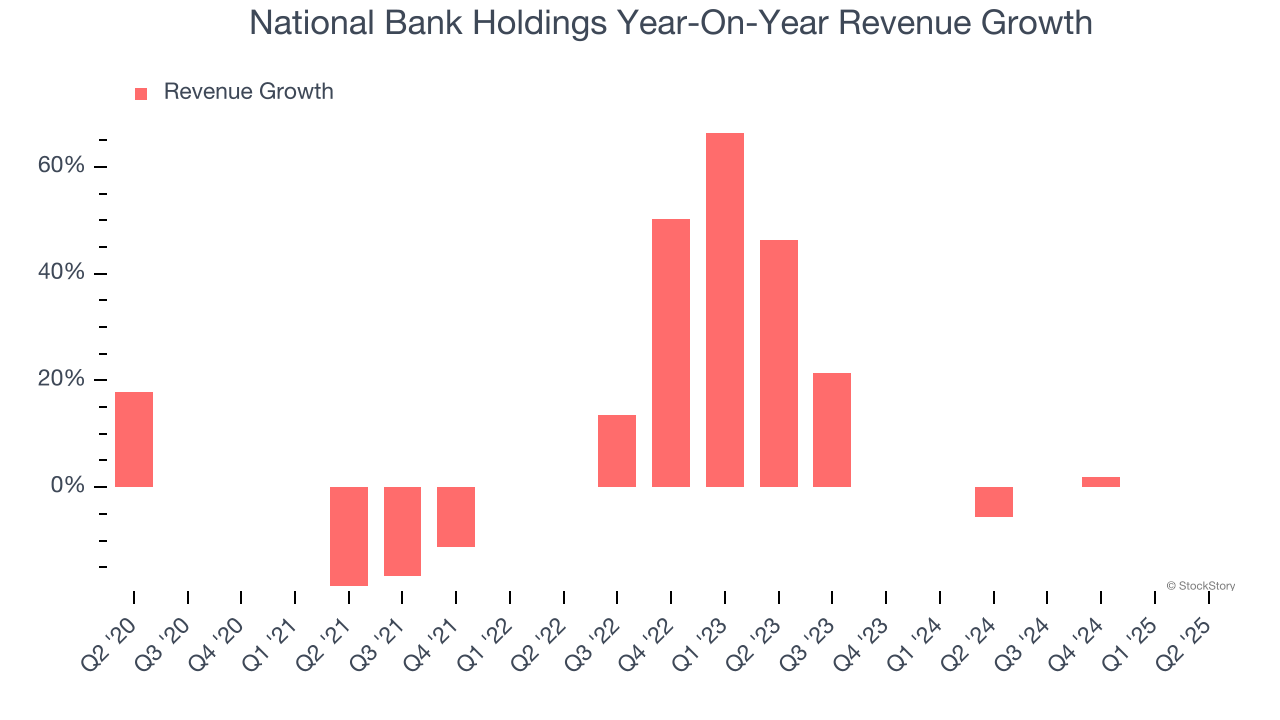 Note: Quarters not shown were determined to be outliers, impacted by outsized investment gains/losses that are not indicative of the recurring fundamentals of the business.
This quarter, National Bank Holdings’s revenue grew by 4% year on year to $104.5 million, falling short of Wall Street’s estimates.
Net interest income made up 76.1% of the company’s total revenue during the last five years, meaning lending operations are National Bank Holdings’s largest source of revenue.
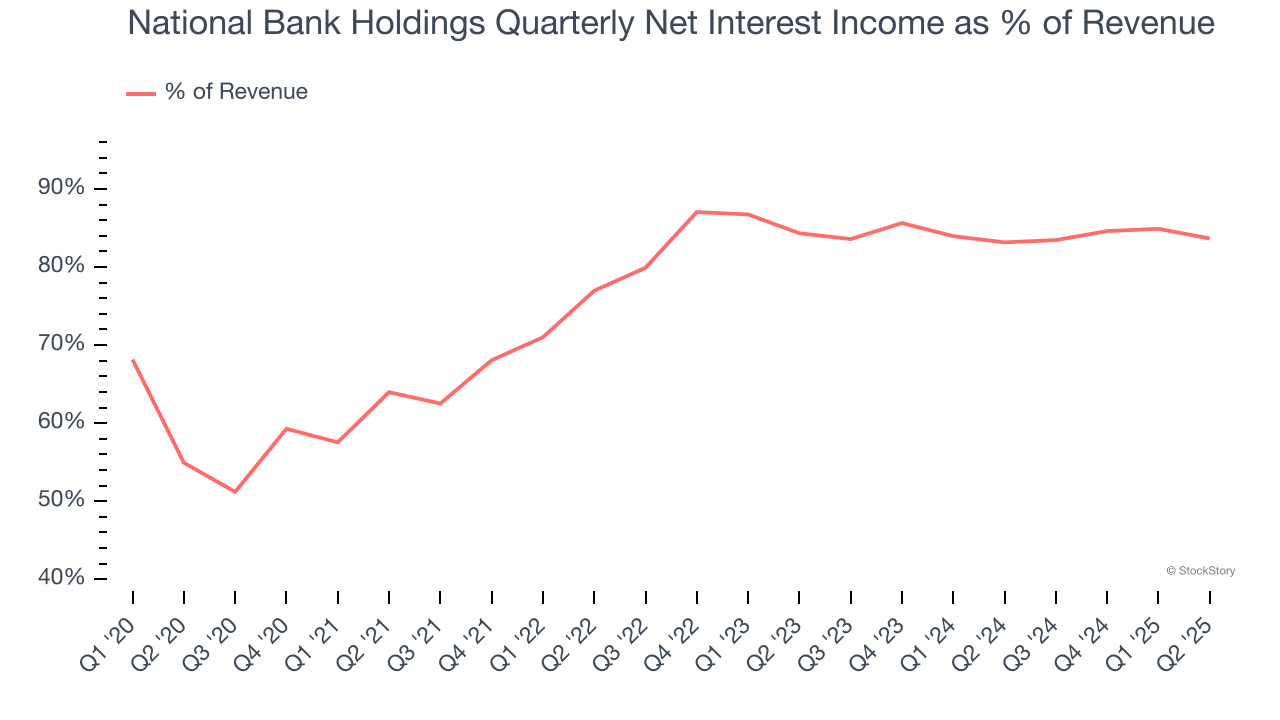
Our experience and research show the market cares primarily about a bank’s net interest income growth as non-interest income is considered a lower-quality and non-recurring revenue source.
Today’s young investors won’t have read the timeless lessons in Gorilla Game: Picking Winners In High Technology because it was written more than 20 years ago when Microsoft and Apple were first establishing their supremacy. But if we apply the same principles, then enterprise software stocks leveraging their own generative AI capabilities may well be the Gorillas of the future. So, in that spirit, we are excited to present our Special Free Report on a profitable, fast-growing enterprise software stock that is already riding the automation wave and looking to catch the generative AI next.
Tangible Book Value Per Share (TBVPS)
Banks operate as balance sheet businesses, with profits generated through borrowing and lending activities. Valuations reflect this reality, emphasizing balance sheet strength and long-term book value compounding ability.
When analyzing banks, tangible book value per share (TBVPS) takes precedence over many other metrics. This measure isolates genuine per-share value by removing intangible assets of debatable liquidation worth. Other (and more commonly known) per-share metrics like EPS can sometimes be murky due to M&A or accounting rules allowing for loan losses to be spread out.
National Bank Holdings’s TBVPS grew at a mediocre 4.5% annual clip over the last five years. However, TBVPS growth has accelerated recently, growing by 13.6% annually over the last two years from $20.64 to $26.64 per share.
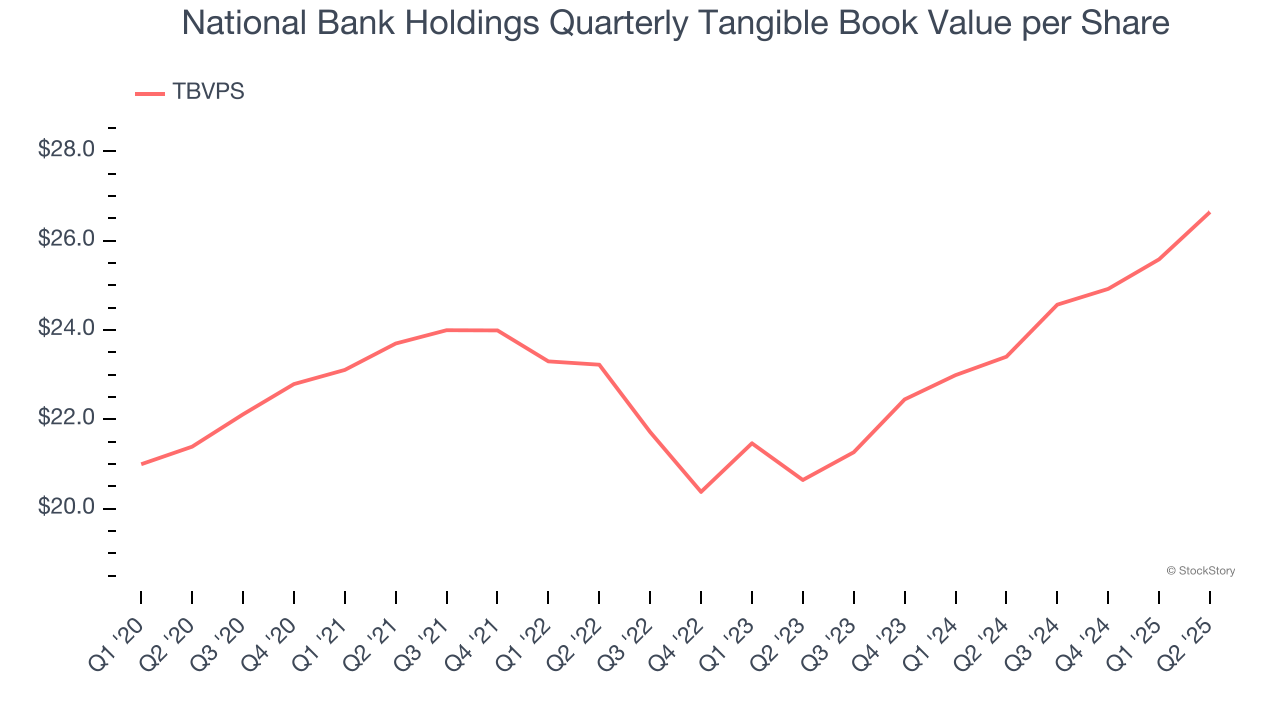
Over the next 12 months, Consensus estimates call for National Bank Holdings’s TBVPS to grow by 9.9% to $29.29, solid growth rate.
Key Takeaways from National Bank Holdings’s Q2 Results
It was encouraging to see National Bank Holdings beat analysts’ EPS expectations this quarter. On the other hand, its revenue and net interest income fell short of Wall Street’s estimates. Overall, this was a weaker quarter. The stock remained flat at $39.21 immediately after reporting.
National Bank Holdings’s earnings report left more to be desired. Let’s look forward to see if this quarter has created an opportunity to buy the stock. What happened in the latest quarter matters, but not as much as longer-term business quality and valuation, when deciding whether to invest in this stock. We cover that in our actionable full research report which you can read here, it’s free.