
Regional banking company Renasant (NYSE: RNST) reported revenue ahead of Wall Street’s expectations in Q2 CY2025, with sales up 60.6% year on year to $267.2 million. Its non-GAAP profit of $0.69 per share was 5.7% below analysts’ consensus estimates.
Is now the time to buy Renasant? Find out by accessing our full research report, it’s free.
Renasant (RNST) Q2 CY2025 Highlights:
- Net Interest Income: $218.9 million vs analyst estimates of $214.3 million (75.1% year-on-year growth, 2.1% beat)
- Net Interest Margin: 3.9% vs analyst estimates of 3.7% (54 basis point year-on-year increase, 14 bps beat)
- Revenue: $267.2 million vs analyst estimates of $260.5 million (60.6% year-on-year growth, 2.6% beat)
- Efficiency Ratio: 67.6% vs analyst estimates of 61.8% (5.8 percentage point miss)
- Adjusted EPS: $0.69 vs analyst expectations of $0.73 (5.7% miss)
- Market Capitalization: $3.65 billion
Company Overview
Founded in 1904 during a time when the South was rebuilding its economy, Renasant (NYSE: RNST) is a regional bank holding company that offers banking, wealth management, insurance, and specialized lending services throughout the Southeast.
Sales Growth
Two primary revenue streams drive bank earnings. While net interest income, which is earned by charging higher rates on loans than paid on deposits, forms the foundation, fee-based services across banking, credit, wealth management, and trading operations provide additional income.
Regrettably, Renasant’s revenue grew at a mediocre 4.9% compounded annual growth rate over the last five years. This fell short of our benchmark for the bank sector and is a tough starting point for our analysis.
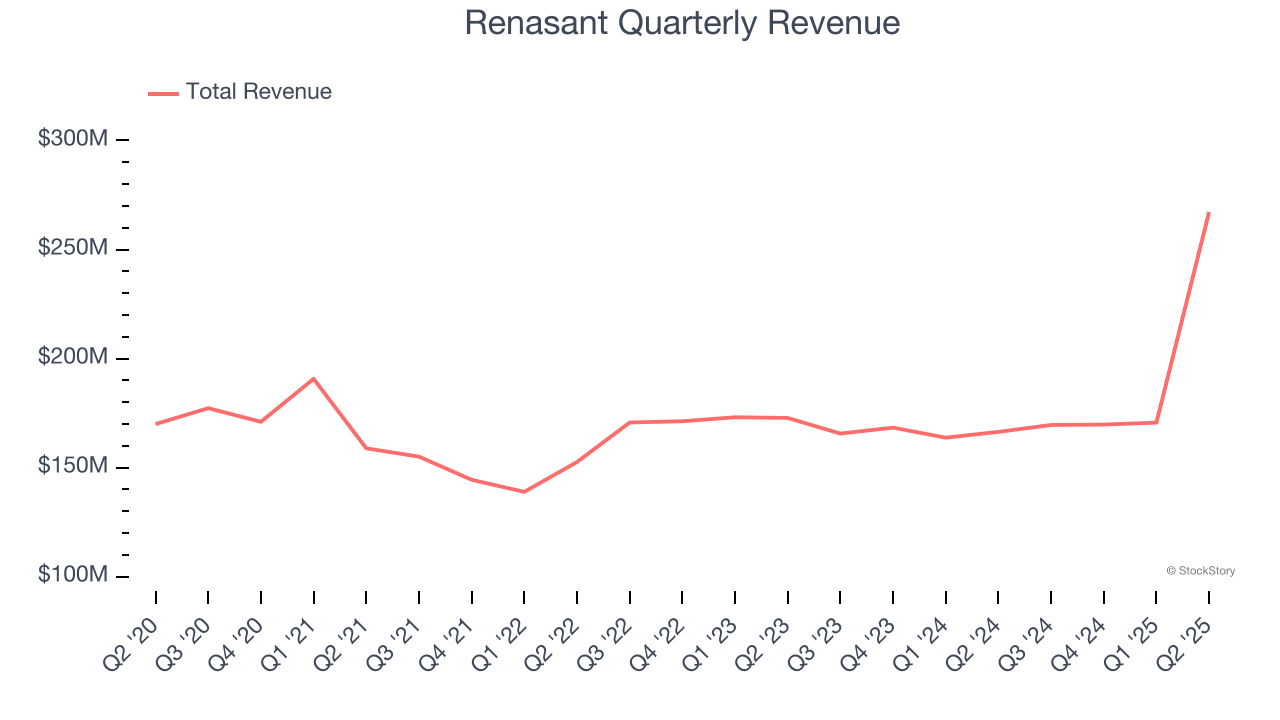
We at StockStory place the most emphasis on long-term growth, but within financials, a half-decade historical view may miss recent interest rate changes, market returns, and industry trends. Renasant’s annualized revenue growth of 6.3% over the last two years is above its five-year trend, suggesting some bright spots. 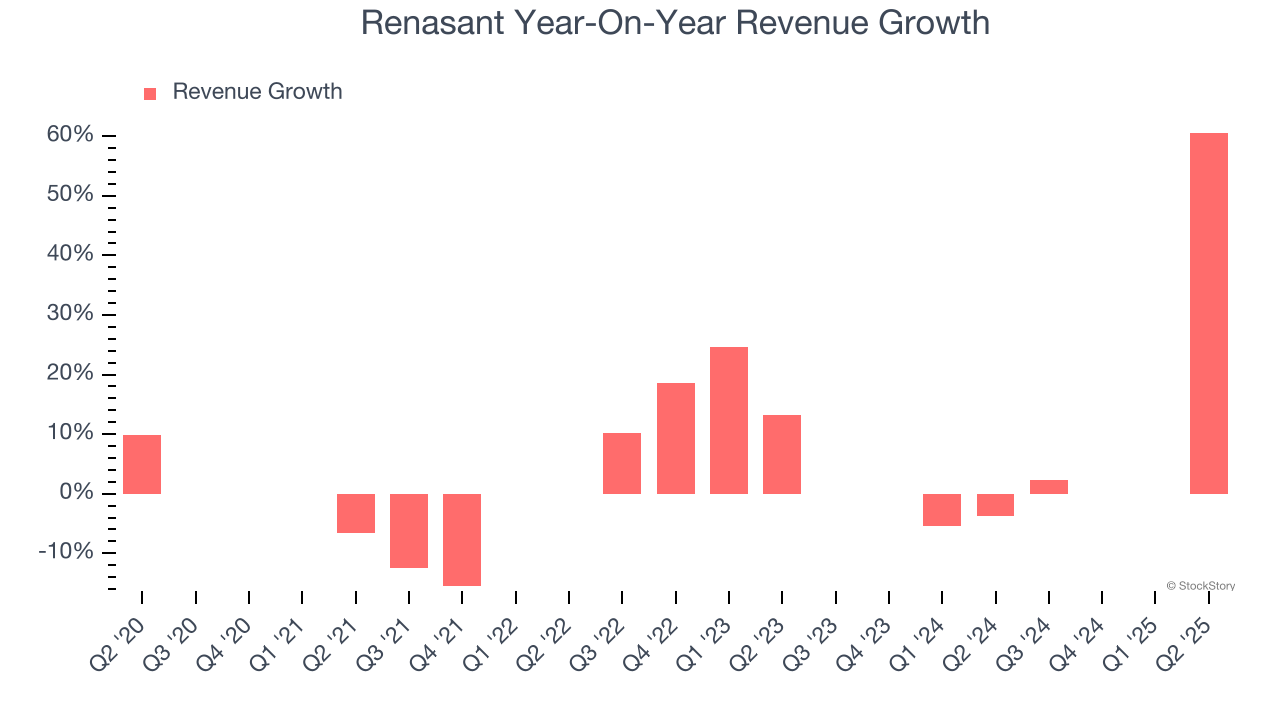 Note: Quarters not shown were determined to be outliers, impacted by outsized investment gains/losses that are not indicative of the recurring fundamentals of the business.
This quarter, Renasant reported magnificent year-on-year revenue growth of 60.6%, and its $267.2 million of revenue beat Wall Street’s estimates by 2.6%.
Net interest income made up 73.1% of the company’s total revenue during the last five years, meaning lending operations are Renasant’s largest source of revenue.
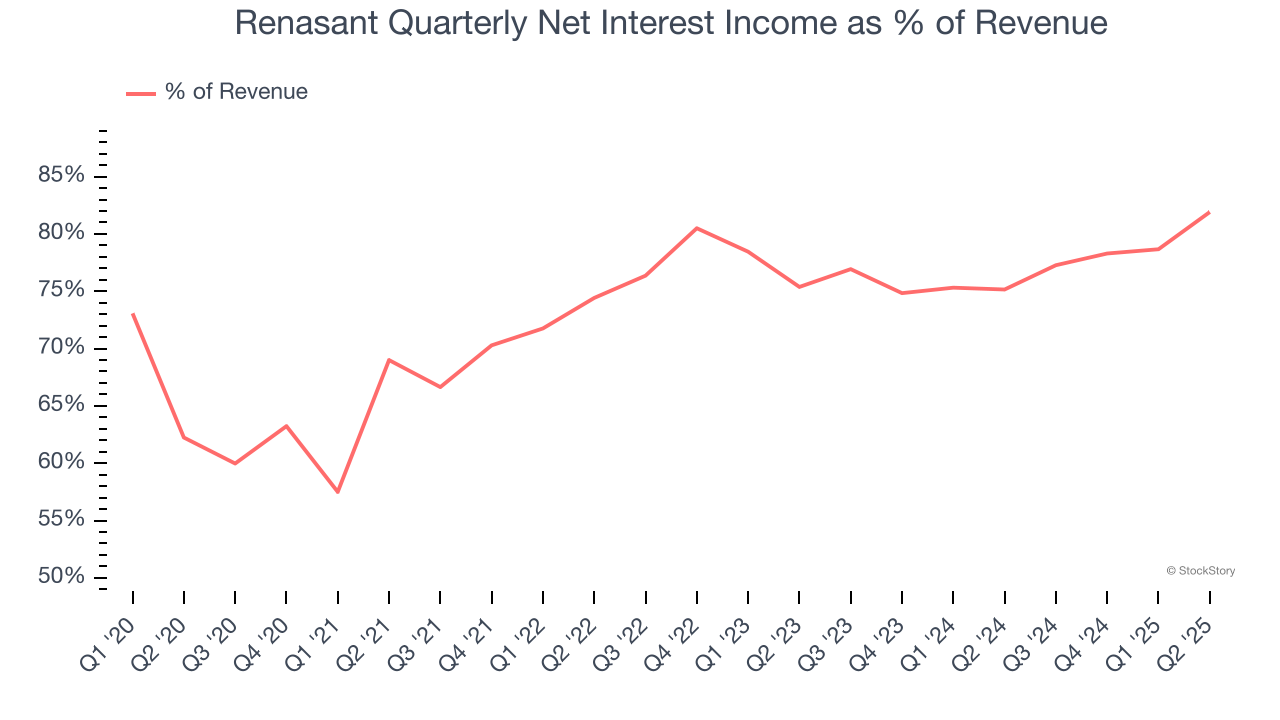
Net interest income commands greater market attention due to its reliability and consistency, whereas non-interest income is often seen as lower-quality revenue that lacks the same dependable characteristics.
Here at StockStory, we certainly understand the potential of thematic investing. Diverse winners from Microsoft (MSFT) to Alphabet (GOOG), Coca-Cola (KO) to Monster Beverage (MNST) could all have been identified as promising growth stories with a megatrend driving the growth. So, in that spirit, we’ve identified a relatively under-the-radar profitable growth stock benefiting from the rise of AI, available to you FREE via this link.
Tangible Book Value Per Share (TBVPS)
Banks profit by intermediating between depositors and borrowers, making them fundamentally balance sheet-driven enterprises. Market participants emphasize balance sheet quality and sustained book value growth when evaluating these institutions.
This is why we consider tangible book value per share (TBVPS) the most important metric to track for banks. TBVPS represents the real, liquid net worth per share of a bank, excluding intangible assets that have debatable value upon liquidation. On the other hand, EPS is often distorted by mergers and flexible loan loss accounting. TBVPS provides clearer performance insights.
Renasant’s TBVPS grew at a tepid 3.2% annual clip over the last five years. The last two years show a similar trajectory as TBVPS grew by 4.1% annually from $21.30 to $23.10 per share.
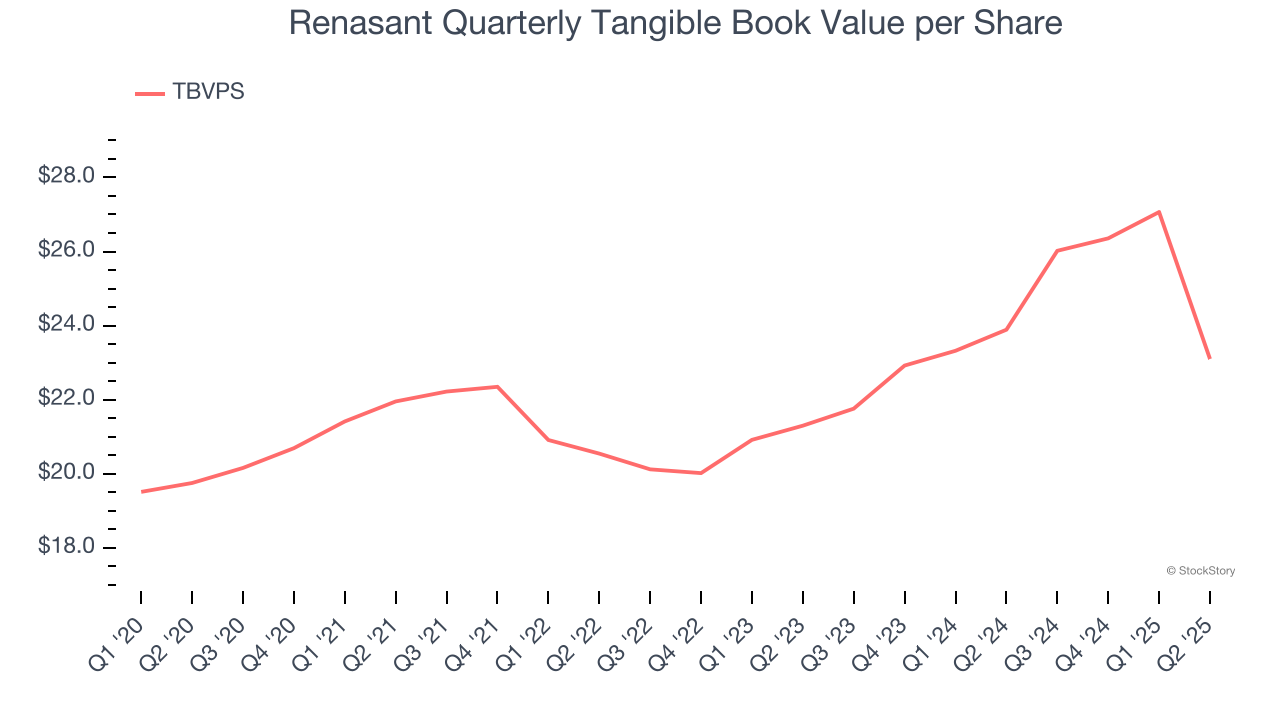
Over the next 12 months, Consensus estimates call for Renasant’s TBVPS to grow by 9% to $25.19, decent growth rate.
Key Takeaways from Renasant’s Q2 Results
We enjoyed seeing Renasant beat analysts’ revenue, net interest income, and NIM expectations this quarter. On the other hand, its EPS and efficiency ratio missed. Overall, this quarter could have been better. The stock traded down 8.1% to $35 immediately after reporting.
Big picture, is Renasant a buy here and now? What happened in the latest quarter matters, but not as much as longer-term business quality and valuation, when deciding whether to invest in this stock. We cover that in our actionable full research report which you can read here, it’s free.