
Toy manufacturing and entertainment company (NASDAQ: MAT) missed Wall Street’s revenue expectations in Q2 CY2025, with sales falling 5.7% year on year to $1.02 billion. Its non-GAAP profit of $0.19 per share was 21.1% above analysts’ consensus estimates.
Is now the time to buy Mattel? Find out by accessing our full research report, it’s free.
Mattel (MAT) Q2 CY2025 Highlights:
- Revenue: $1.02 billion vs analyst estimates of $1.05 billion (5.7% year-on-year decline, 3.2% miss)
- Adjusted EPS: $0.19 vs analyst estimates of $0.16 (21.1% beat)
- Adjusted EBITDA: $169.9 million vs analyst estimates of $158.3 million (16.7% margin, 7.3% beat)
- Operating Margin: 7.7%, in line with the same quarter last year
- Market Capitalization: $6.42 billion
Ynon Kreiz, Chairman and CEO of Mattel, said: “Our second quarter performance reflects operational excellence in the current macroeconomic environment as we continue to execute our strategy to grow Mattel’s IP-driven toy business and expand our entertainment offering. We achieved meaningful gross margin expansion, grew internationally, and further progressed our entertainment slate. We are embracing technology and collaborating with world-class partners to bring our iconic brands to life in new ways to position Mattel for long-term success.”
Company Overview
Known for the creation of iconic toys such as Barbie and Hotwheels, Mattel (NASDAQ: MAT) is a global children's entertainment company specializing in the design and production of consumer products.
Revenue Growth
Reviewing a company’s long-term sales performance reveals insights into its quality. Even a bad business can shine for one or two quarters, but a top-tier one grows for years. Unfortunately, Mattel’s 4.5% annualized revenue growth over the last five years was sluggish. This was below our standard for the consumer discretionary sector and is a poor baseline for our analysis.
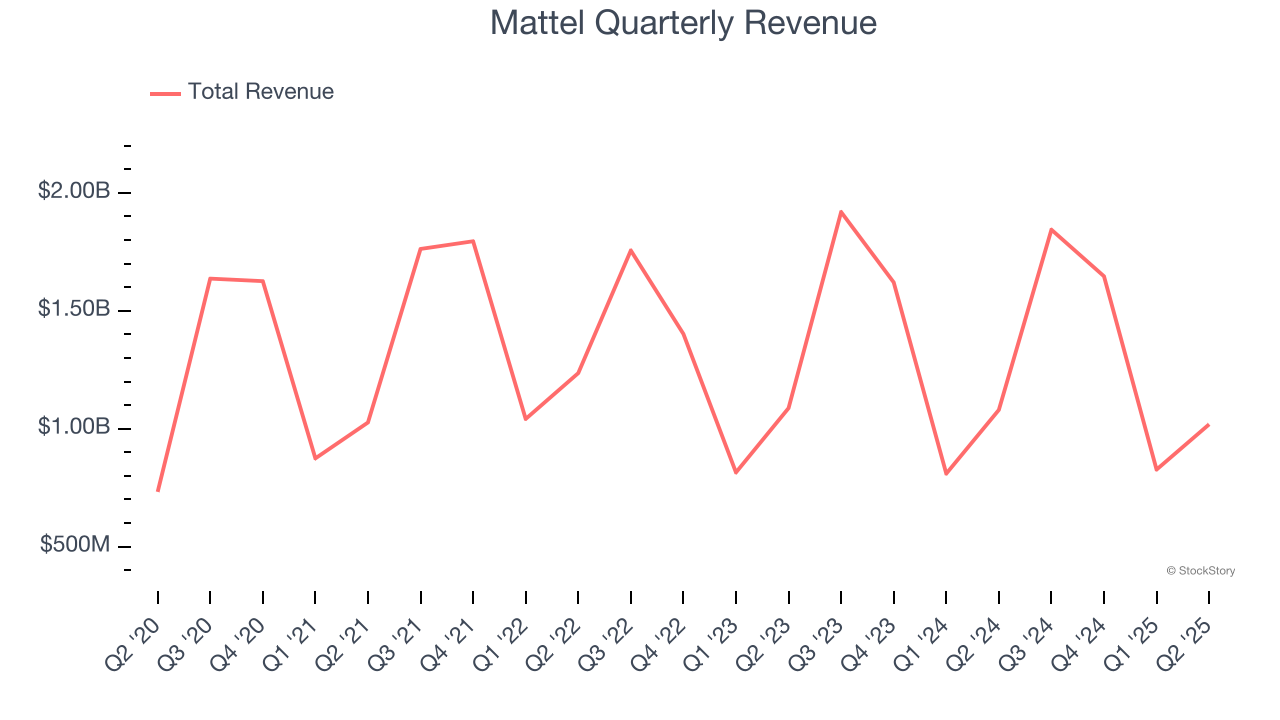
Long-term growth is the most important, but within consumer discretionary, product cycles are short and revenue can be hit-driven due to rapidly changing trends and consumer preferences. Mattel’s recent performance shows its demand has slowed as its annualized revenue growth of 2.7% over the last two years was below its five-year trend. 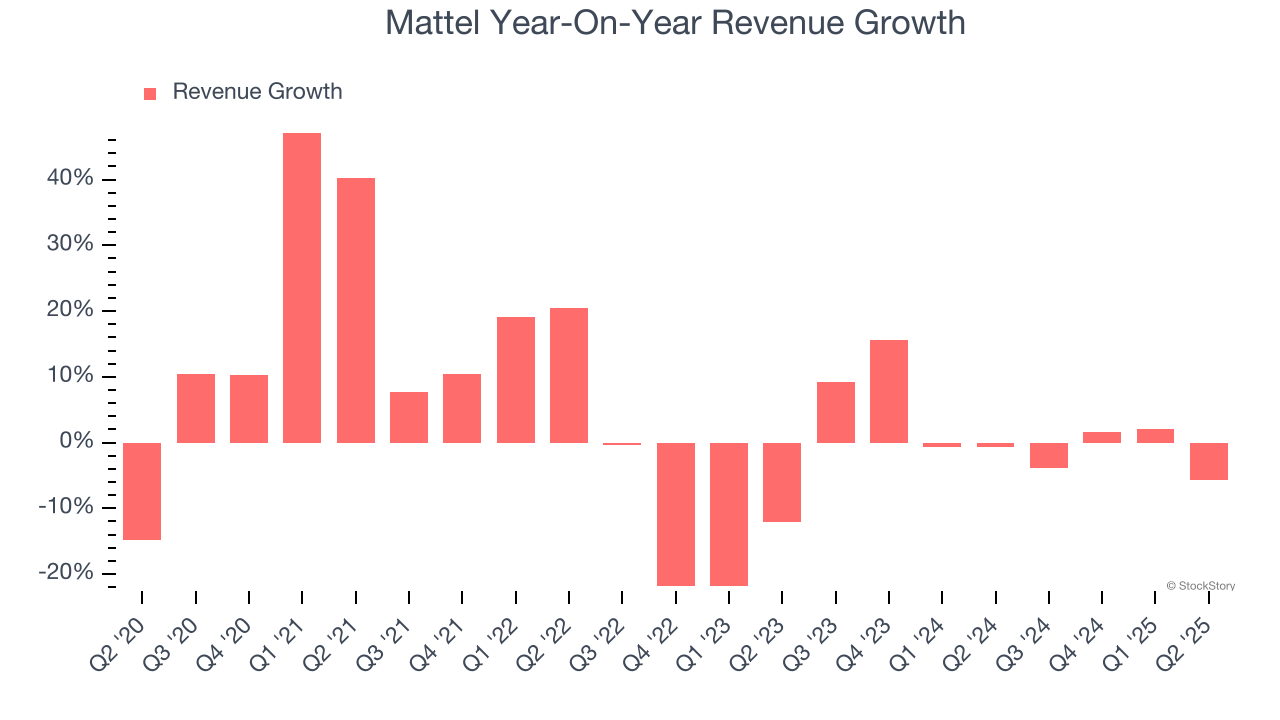
This quarter, Mattel missed Wall Street’s estimates and reported a rather uninspiring 5.7% year-on-year revenue decline, generating $1.02 billion of revenue.
Looking ahead, sell-side analysts expect revenue to grow 2.5% over the next 12 months, similar to its two-year rate. This projection doesn't excite us and indicates its newer products and services will not accelerate its top-line performance yet.
Software is eating the world and there is virtually no industry left that has been untouched by it. That drives increasing demand for tools helping software developers do their jobs, whether it be monitoring critical cloud infrastructure, integrating audio and video functionality, or ensuring smooth content streaming. Click here to access a free report on our 3 favorite stocks to play this generational megatrend.
Operating Margin
Operating margin is a key measure of profitability. Think of it as net income - the bottom line - excluding the impact of taxes and interest on debt, which are less connected to business fundamentals.
Mattel’s operating margin might fluctuated slightly over the last 12 months but has generally stayed the same, averaging 13.5% over the last two years. This profitability was solid for a consumer discretionary business and shows it’s an efficient company that manages its expenses well.
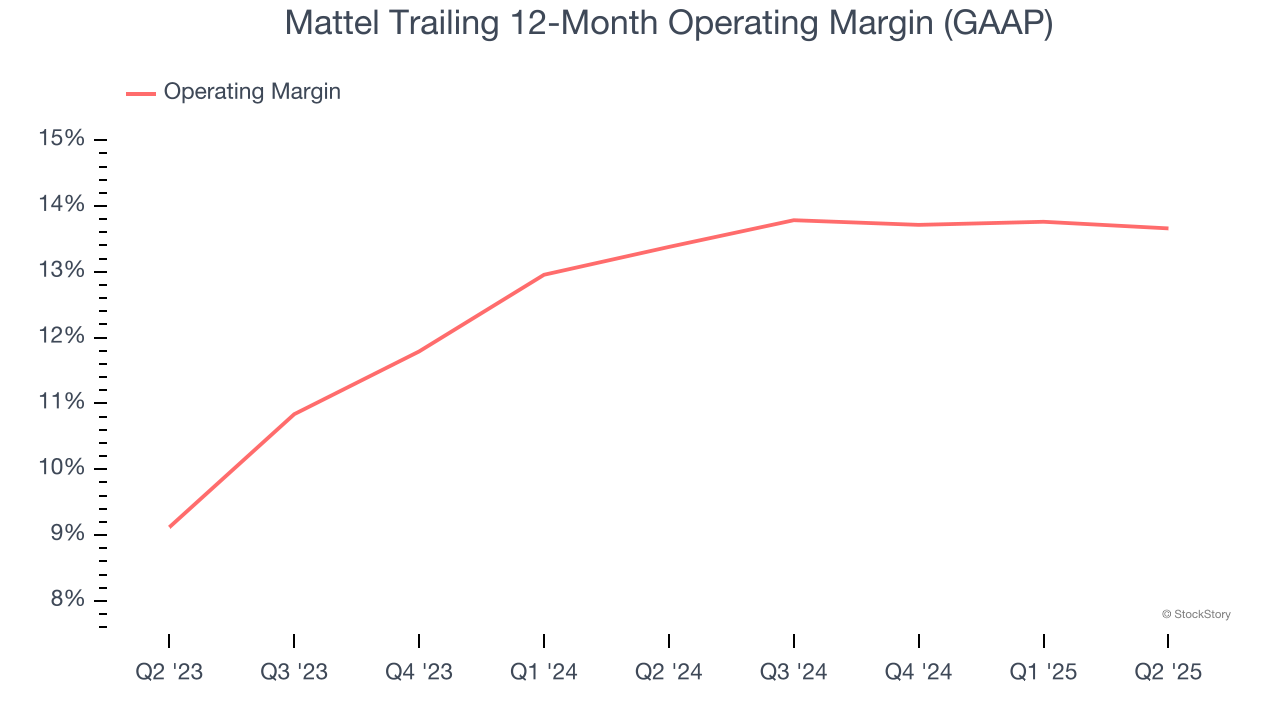
In Q2, Mattel generated an operating margin profit margin of 7.7%, in line with the same quarter last year. This indicates the company’s overall cost structure has been relatively stable.
Earnings Per Share
We track the long-term change in earnings per share (EPS) for the same reason as long-term revenue growth. Compared to revenue, however, EPS highlights whether a company’s growth is profitable.
Mattel’s full-year EPS flipped from negative to positive over the last five years. This is encouraging and shows it’s at a critical moment in its life.
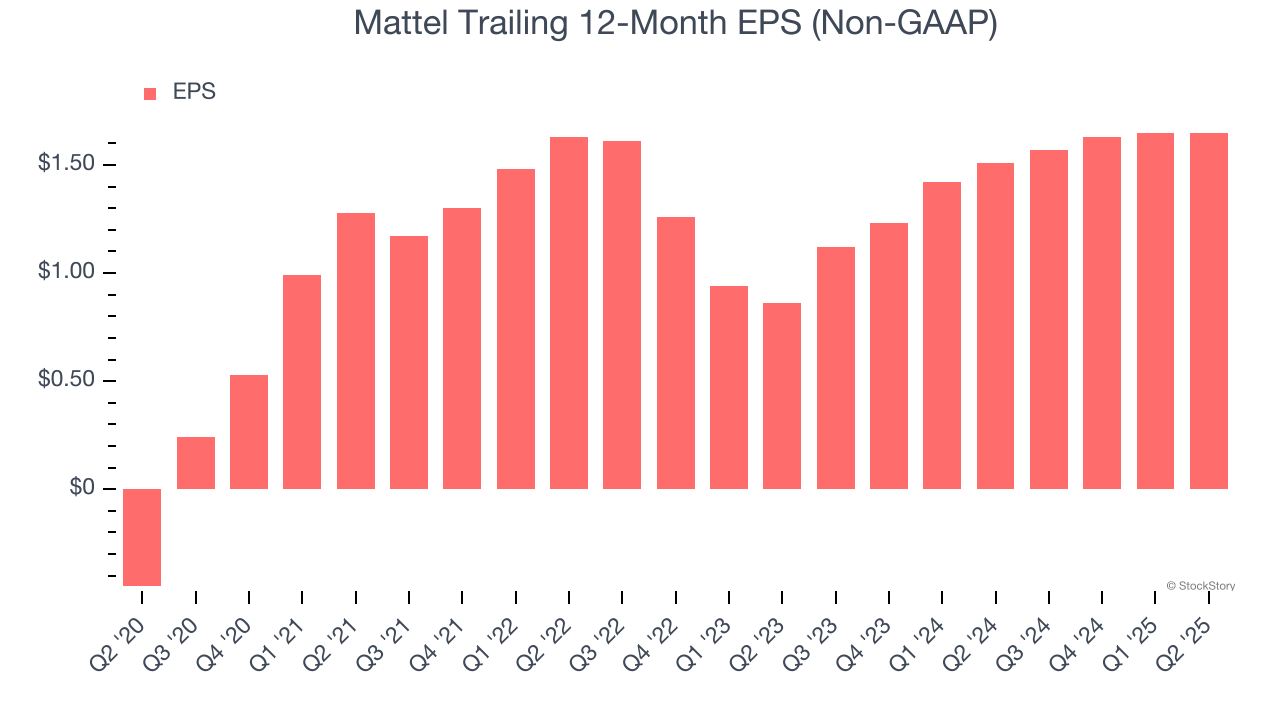
In Q2, Mattel reported EPS at $0.19, in line with the same quarter last year. This print easily cleared analysts’ estimates, and shareholders should be content with the results. Over the next 12 months, Wall Street expects Mattel’s full-year EPS of $1.65 to stay about the same.
Key Takeaways from Mattel’s Q2 Results
We enjoyed seeing Mattel beat analysts’ EPS expectations this quarter. We were also happy its EBITDA outperformed Wall Street’s estimates. On the other hand, its revenue missed. Zooming out, we think this was a mixed quarter. Investors were likely hoping for more, and shares traded down 4% to $19.40 immediately following the results.
So should you invest in Mattel right now? The latest quarter does matter, but not nearly as much as longer-term fundamentals and valuation, when deciding if the stock is a buy. We cover that in our actionable full research report which you can read here, it’s free.